
SimplifiCAR
Vehicle management mobile app
Year
Client
Services
2021
SimplifiCAR
Product Design
⚠ Disclaimer ⚠ The following study case was fully developed in Portuguese and is fully based on the context of owning a vehicle in Brazil. Because of that some of the problems, solutions, and features may not make fully sense for readers from other countries. Still the study case shows a complete UX Design process going from a problem to a MVP, while doing user research and testing in between. All the text was translated, but the images and the prototypes are still in the original language. I hope you enjoy reading 😄
1 – The challenge
When we were evaluating problems that we could face using a structured UX Design methodology, the idea of reducing the bureaucracy of having a vehicle (car or motorcycle) came up and we decided to face this challenge, in order to answer the following question:
How to reduce the bureaucracy and complexity of the day-to-day tasks needed to own a vehicle?
2 – The current situation
In recent decades, it has become an increasingly complex and bureaucratic task to own a vehicle. What used to be more of an everyday item has become a real headache for many homeowners, perhaps because of the rush we live in today. To only make this scenario worse, vehicles are becoming more and more complex, and thus needing more qualified and specialized mechanics, often difficult to find. There is also a lack of time to take the vehicle for maintenance, which leads to many owners taking their vehicles to mechanic shops only when they have problems, which can be expensive and risky, often compromising the safety of the driver and passengers. According to Diego Riquero, head of Bosch’s automotive training center, “Preventive maintenance is done so that corrective maintenance is not necessary. When it breaks, it’s always more expensive”(uol). But even though most people know this, many still can’t keep their revisions up to date.
On top of that, we still have taxes that must be paid once a year. Many people have difficulties remembering and paying their vehicle taxes, which often leads them to pay late and face fines as a result. All the complexity and cost of these tasks have led many to give up their vehicles and adopt alternatives such as transportation apps and rental cars. With that in mind, we started with the following goal:
- Create a product that solves and simplifies the main pains of our users concerning their vehicles.
- Create a product with simple visual language and navigation, accessible to all users.
- Intermediate the relationship between vehicle owners and services such as mechanic shops and dispatchers, thus facilitating and automating the process.
3 – How did we get to this goal?
We did a Benchmarking of the solutions that already exist on the market in order to see if there were already solutions that addressed the pain and fulfilled the objectives of the product above.
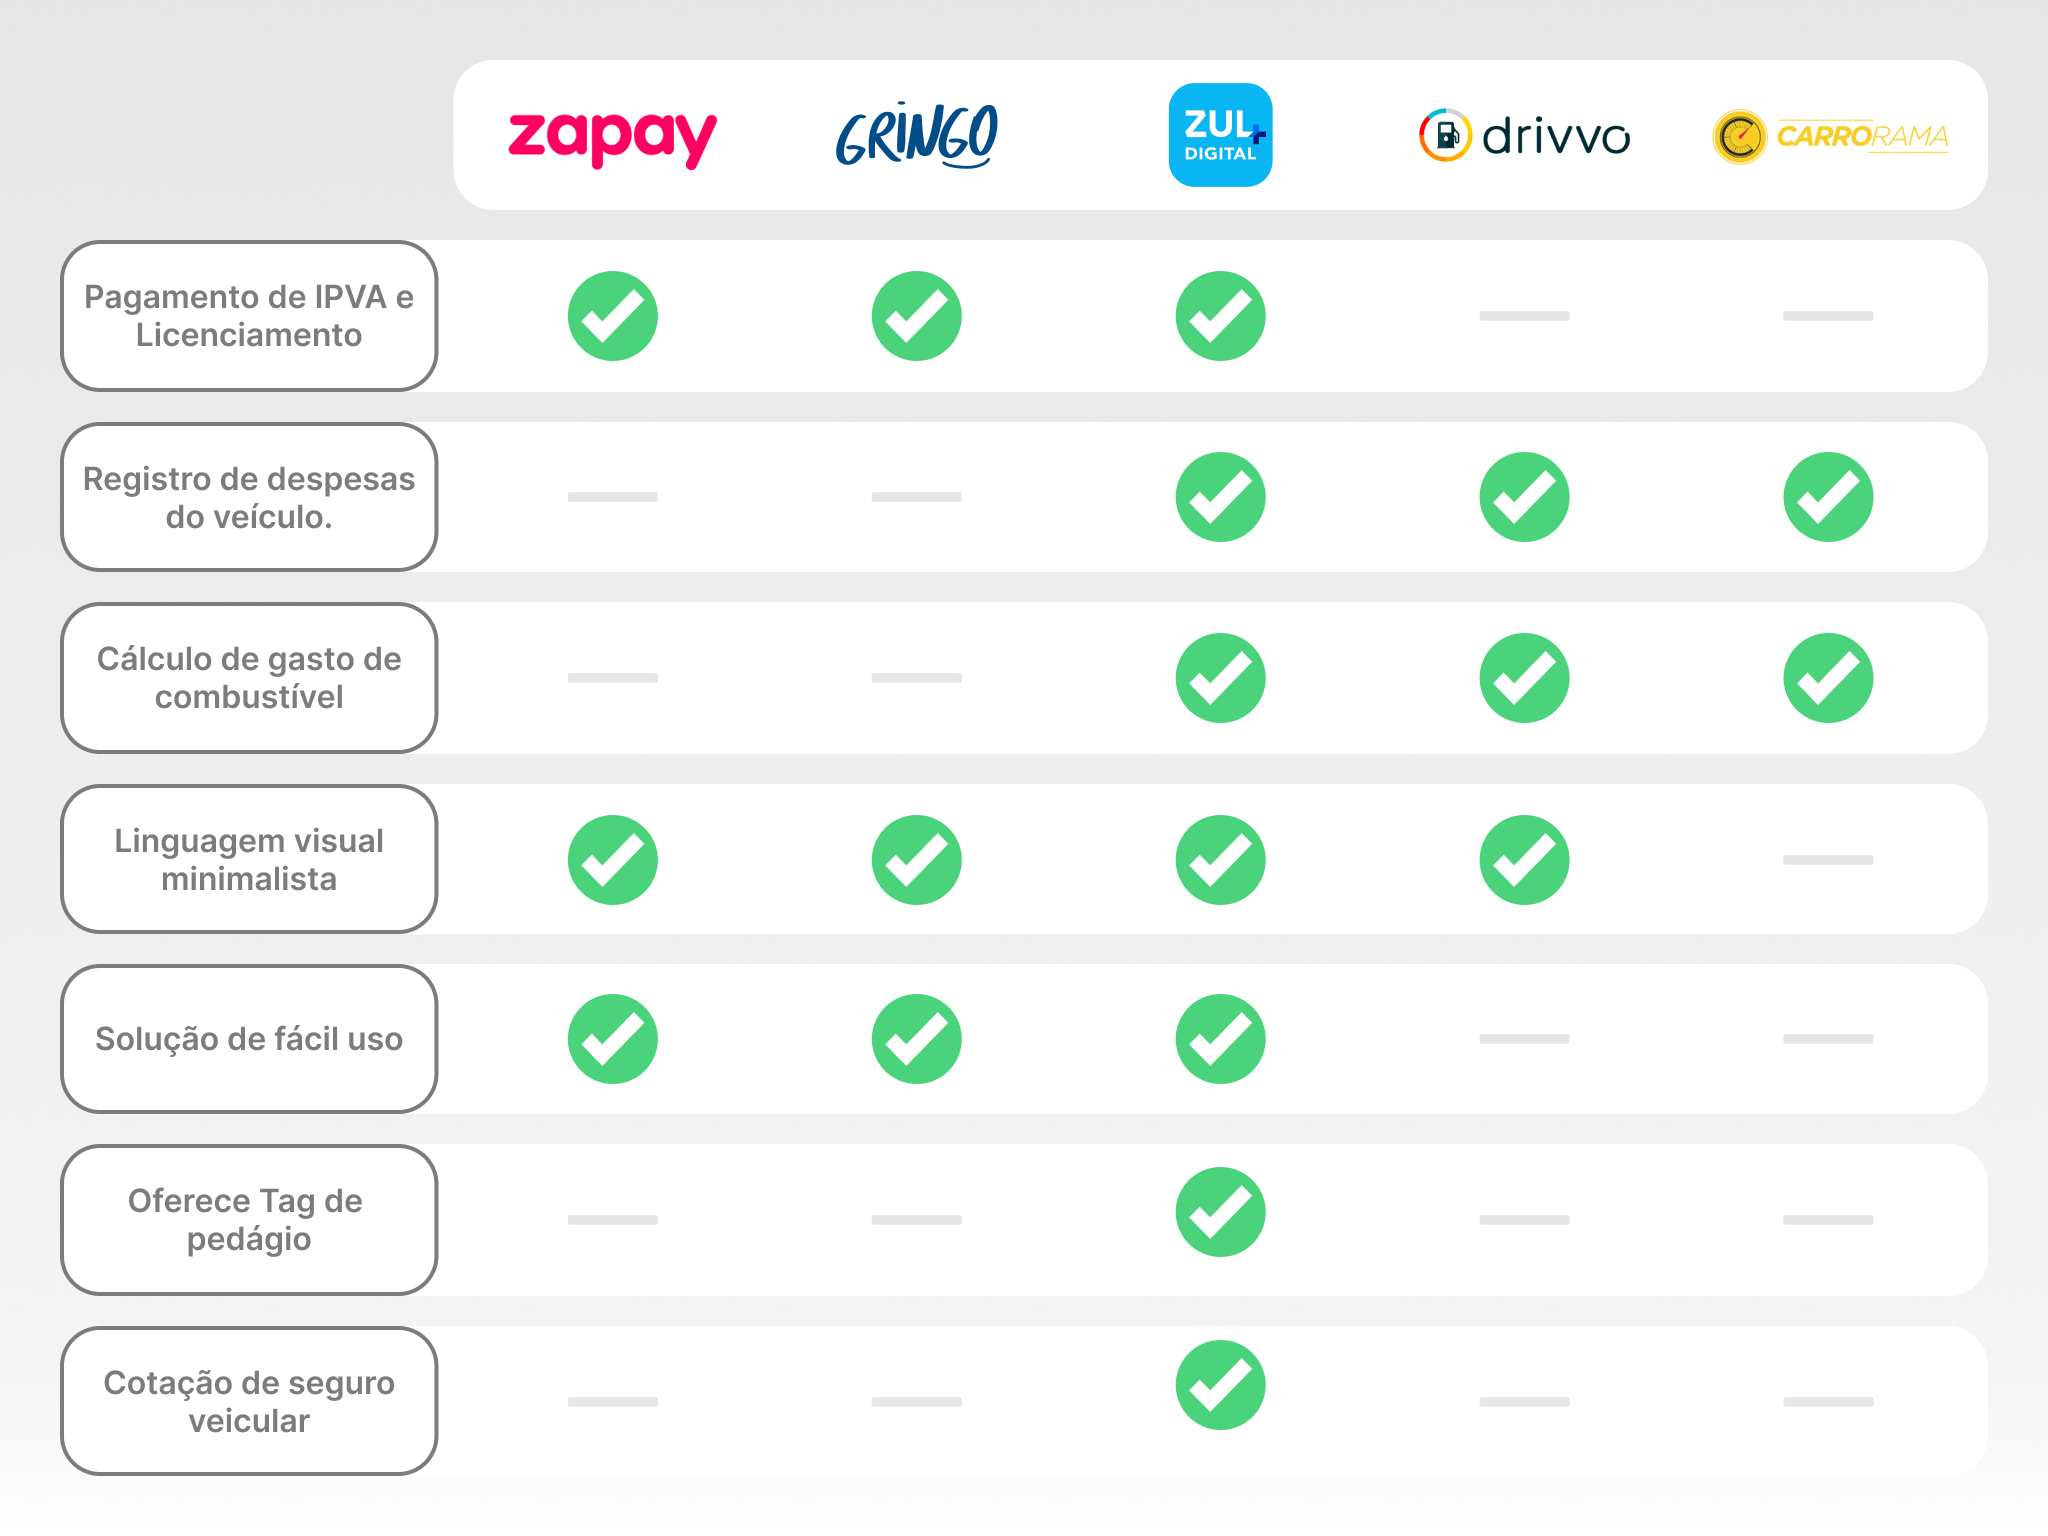
The conclusion we reached at this stage is that even though there are already solutions that meet the user’s needs, they focus on just a few elements of the vehicle owner’s day-to-day life and do not yet offer automation features, requiring a lot of effort on the part of the user to keep the solution up to date.
4 – The business plan
Before starting the research, we decided to create a business plan based on the idea we had in mind, with the aim of making it easier to raise hypotheses to be validated in the research stage.
Our idea was a solution where the owner could easily, quickly and cheaply solve the main necessary tasks related to his vehicle, namely:
- Pay all vehicle taxes.
- Inspections every 10,000 km or 6 months to ensure the proper functioning of the vehicle and the safety of passengers.
- Payment of toll fee quickly and conveniently.
- Payment of traffic violations (fines).
- Periodic checking of parts of the vehicle that wear out naturally, such as tires, oil and water.
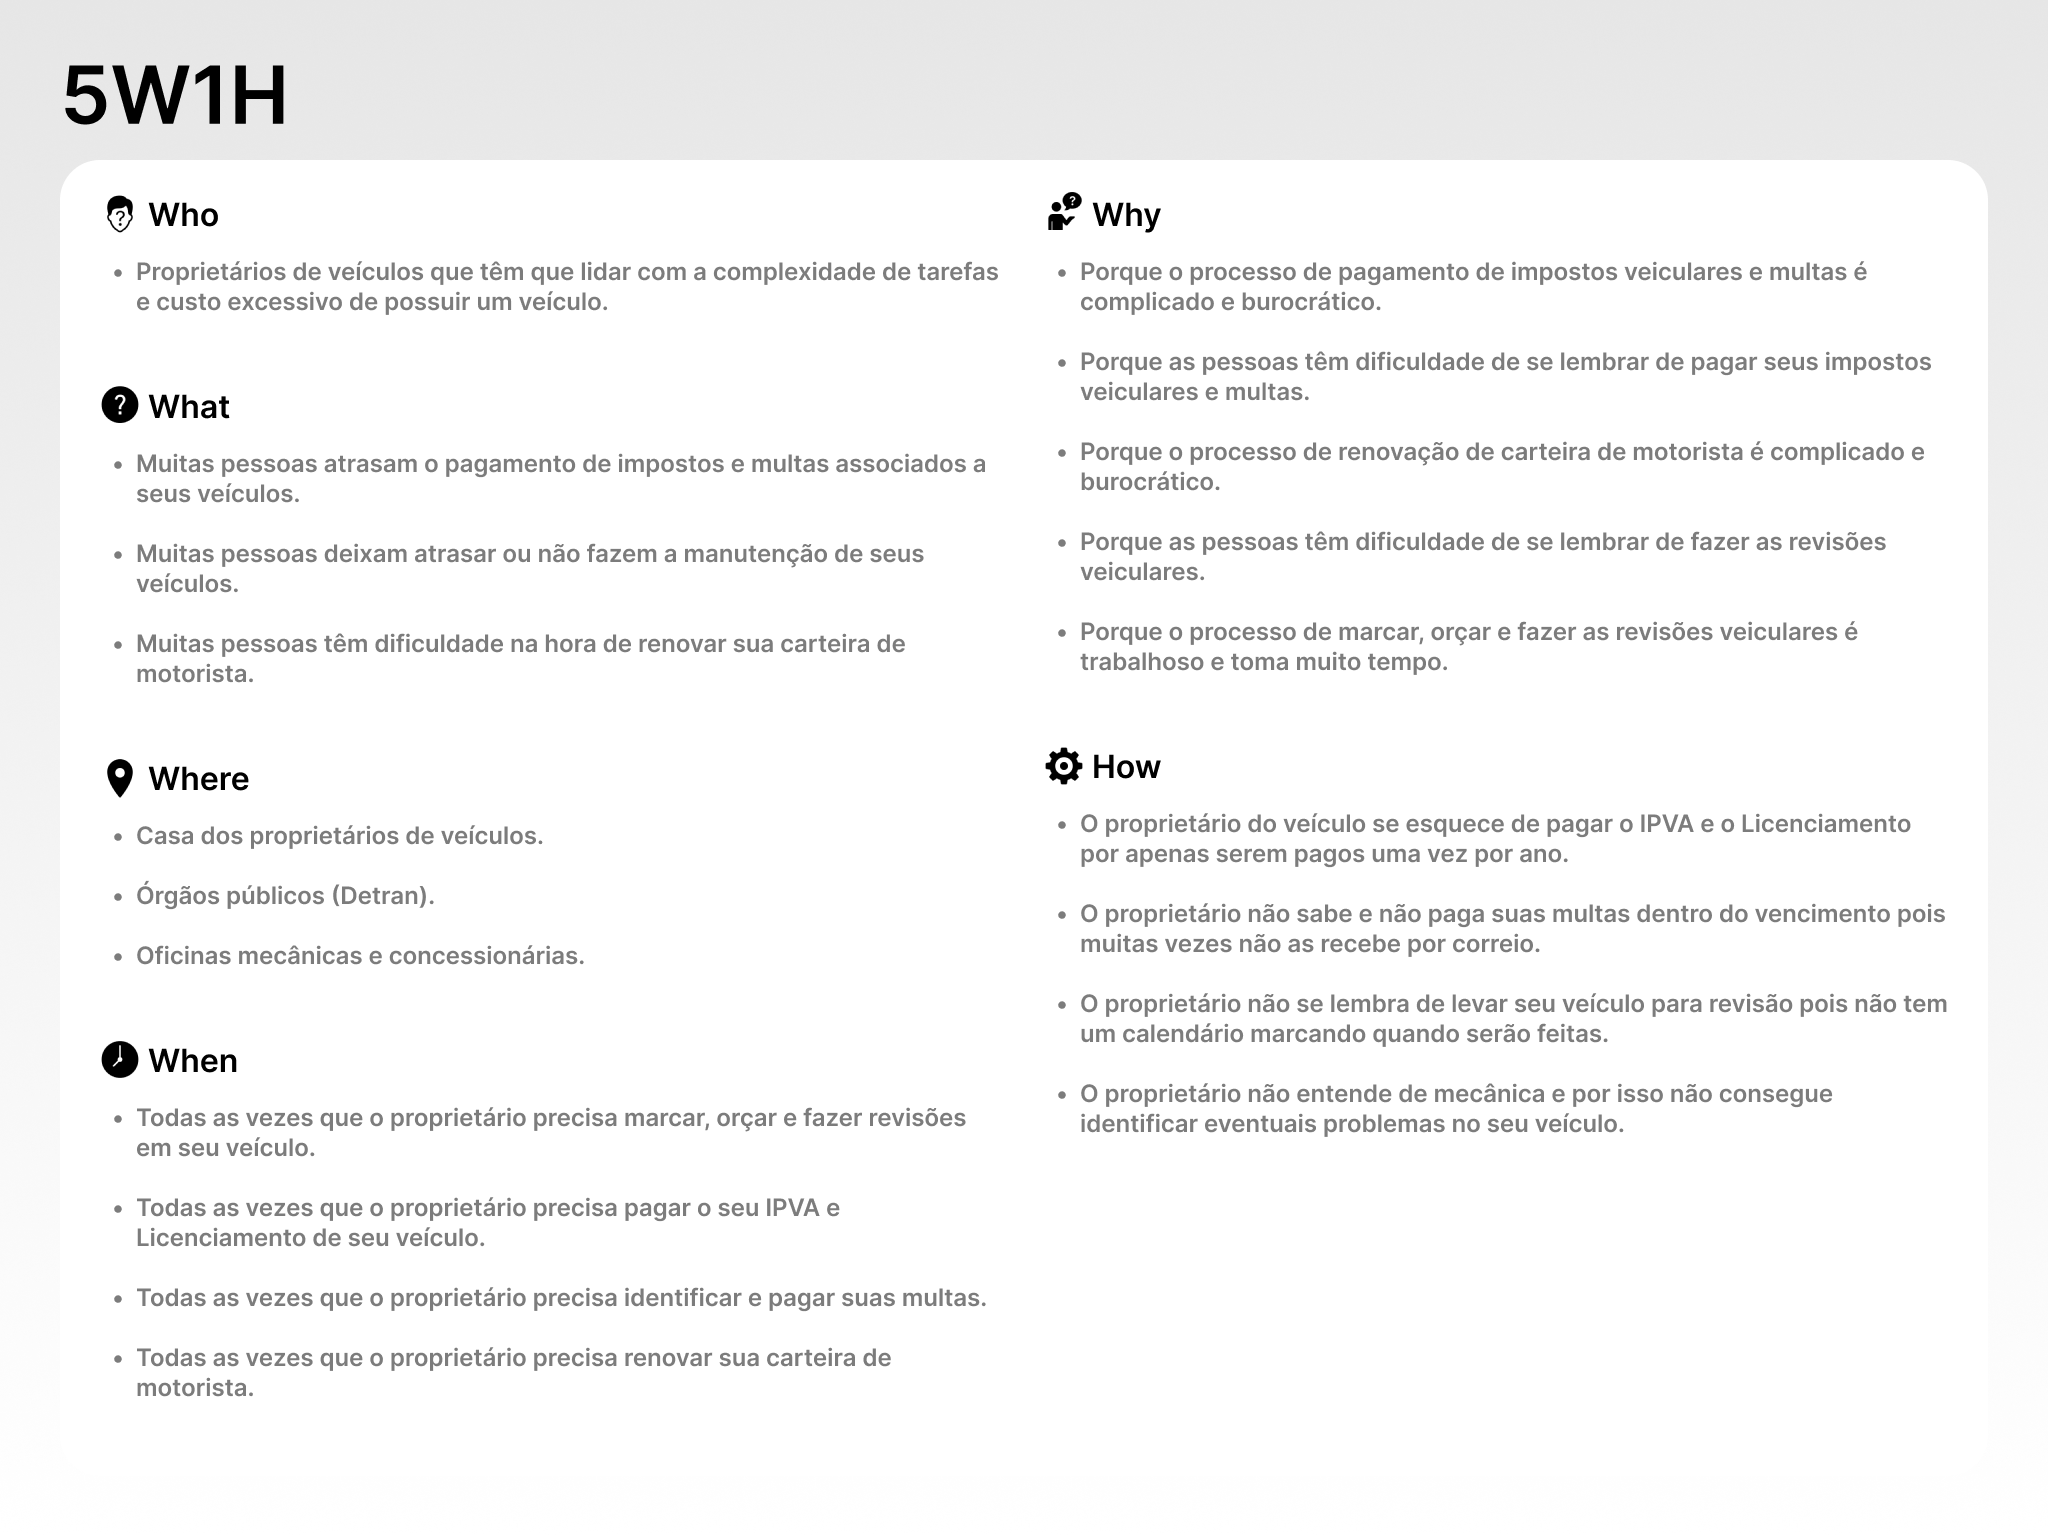
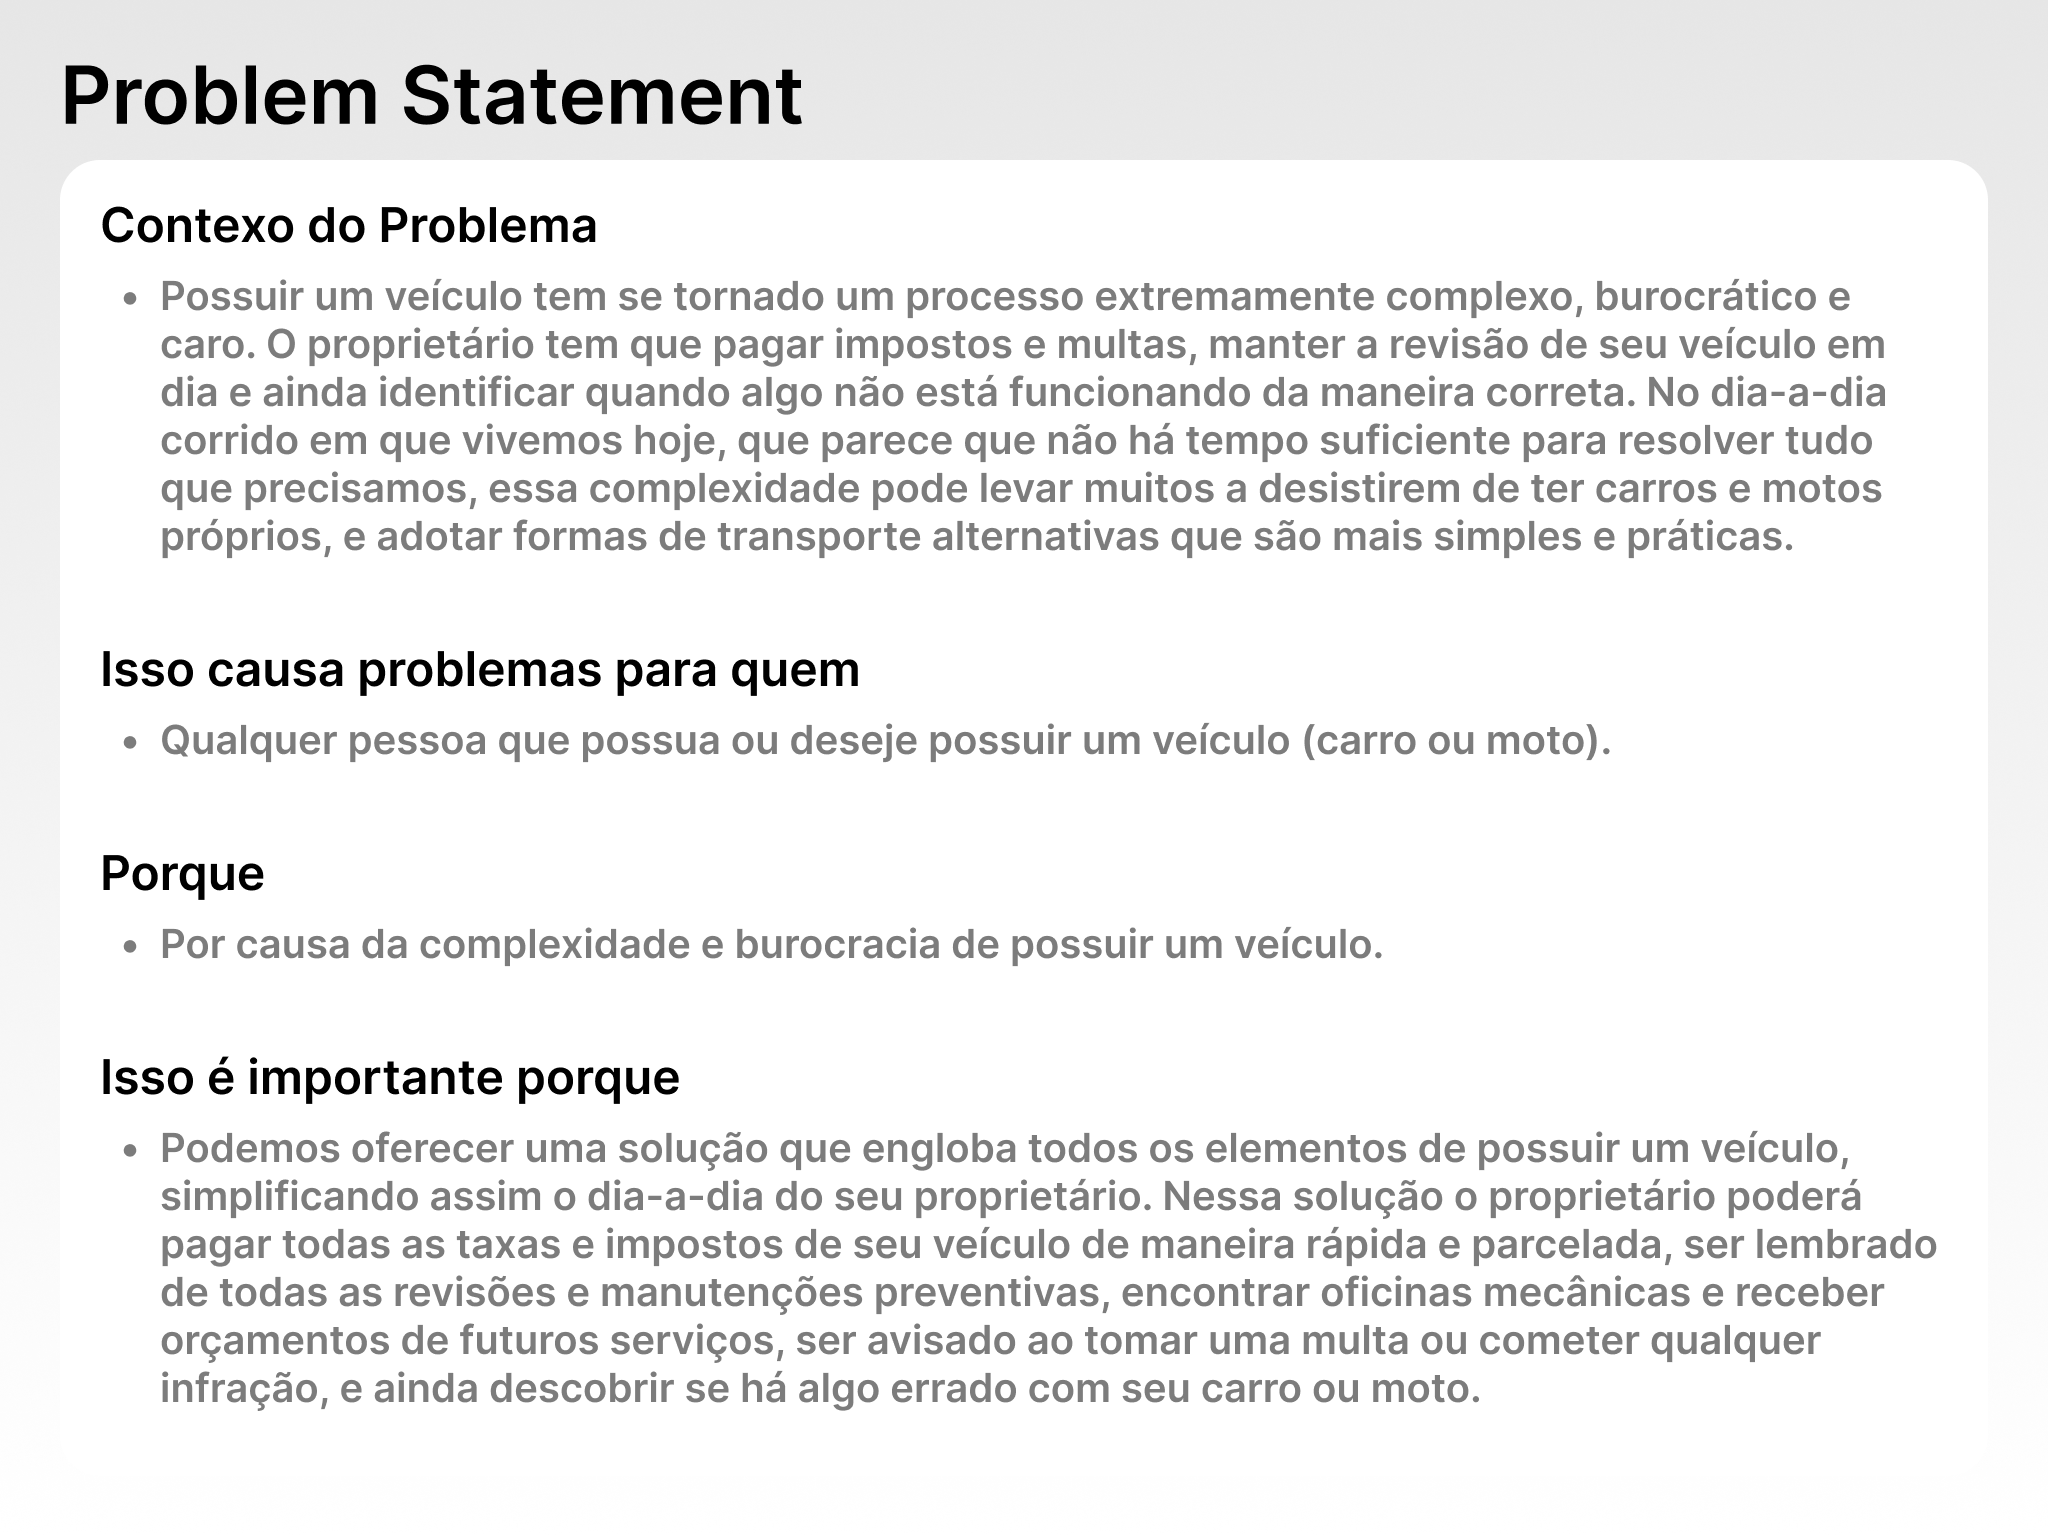
To solve people’s problems and help fulfill the tasks described above in the easiest, fastest, and cheapest way, we decided to create a 5W1H, a Problem Statement, build a Business Model Canvas, and a Value Proposition Canvas to respond accurately and build a business that reflects real needs and is also financially viable.

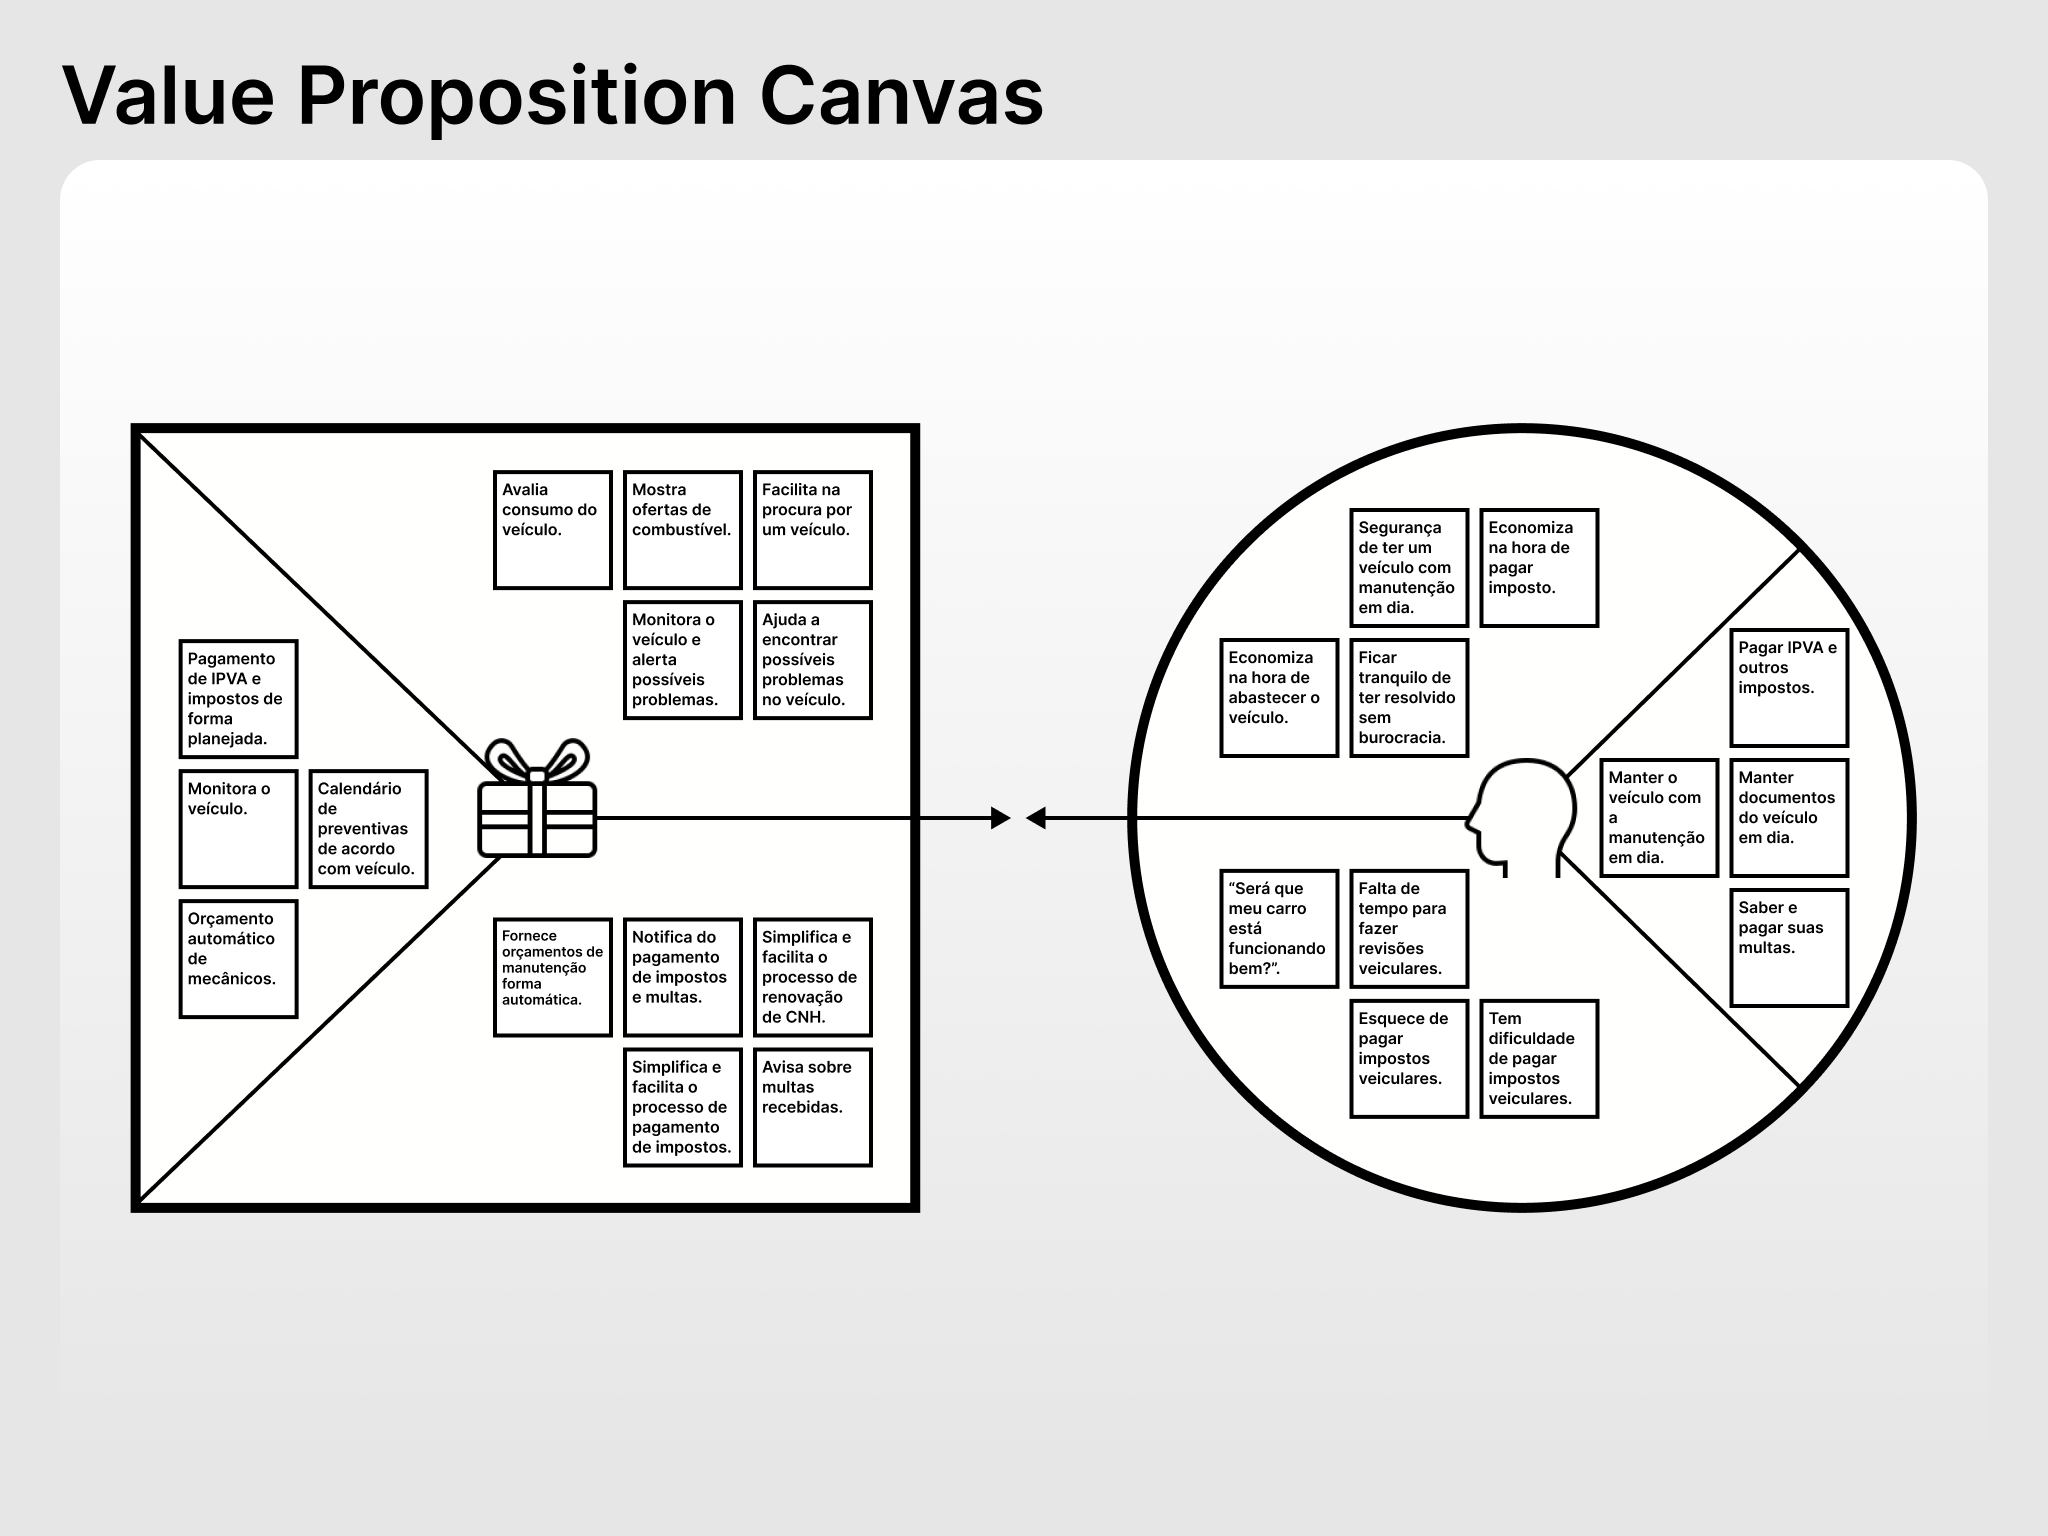
The idea is to deliver value to the user through an integrated and intelligent solution that helps them manage their vehicles, pay their taxes and insurance, be notified of fines, and carry out preventive maintenance (revisions) quickly and easily. From this business plan, we started to raise user and business hypotheses to validate with research.
Now that we had our solution plan built, we proceeded to a preliminary research stage, with the focus of validating this business plan and getting to know more (and in a primary way) about potential users and their needs.
5 – Quantitative and Qualitative User Research
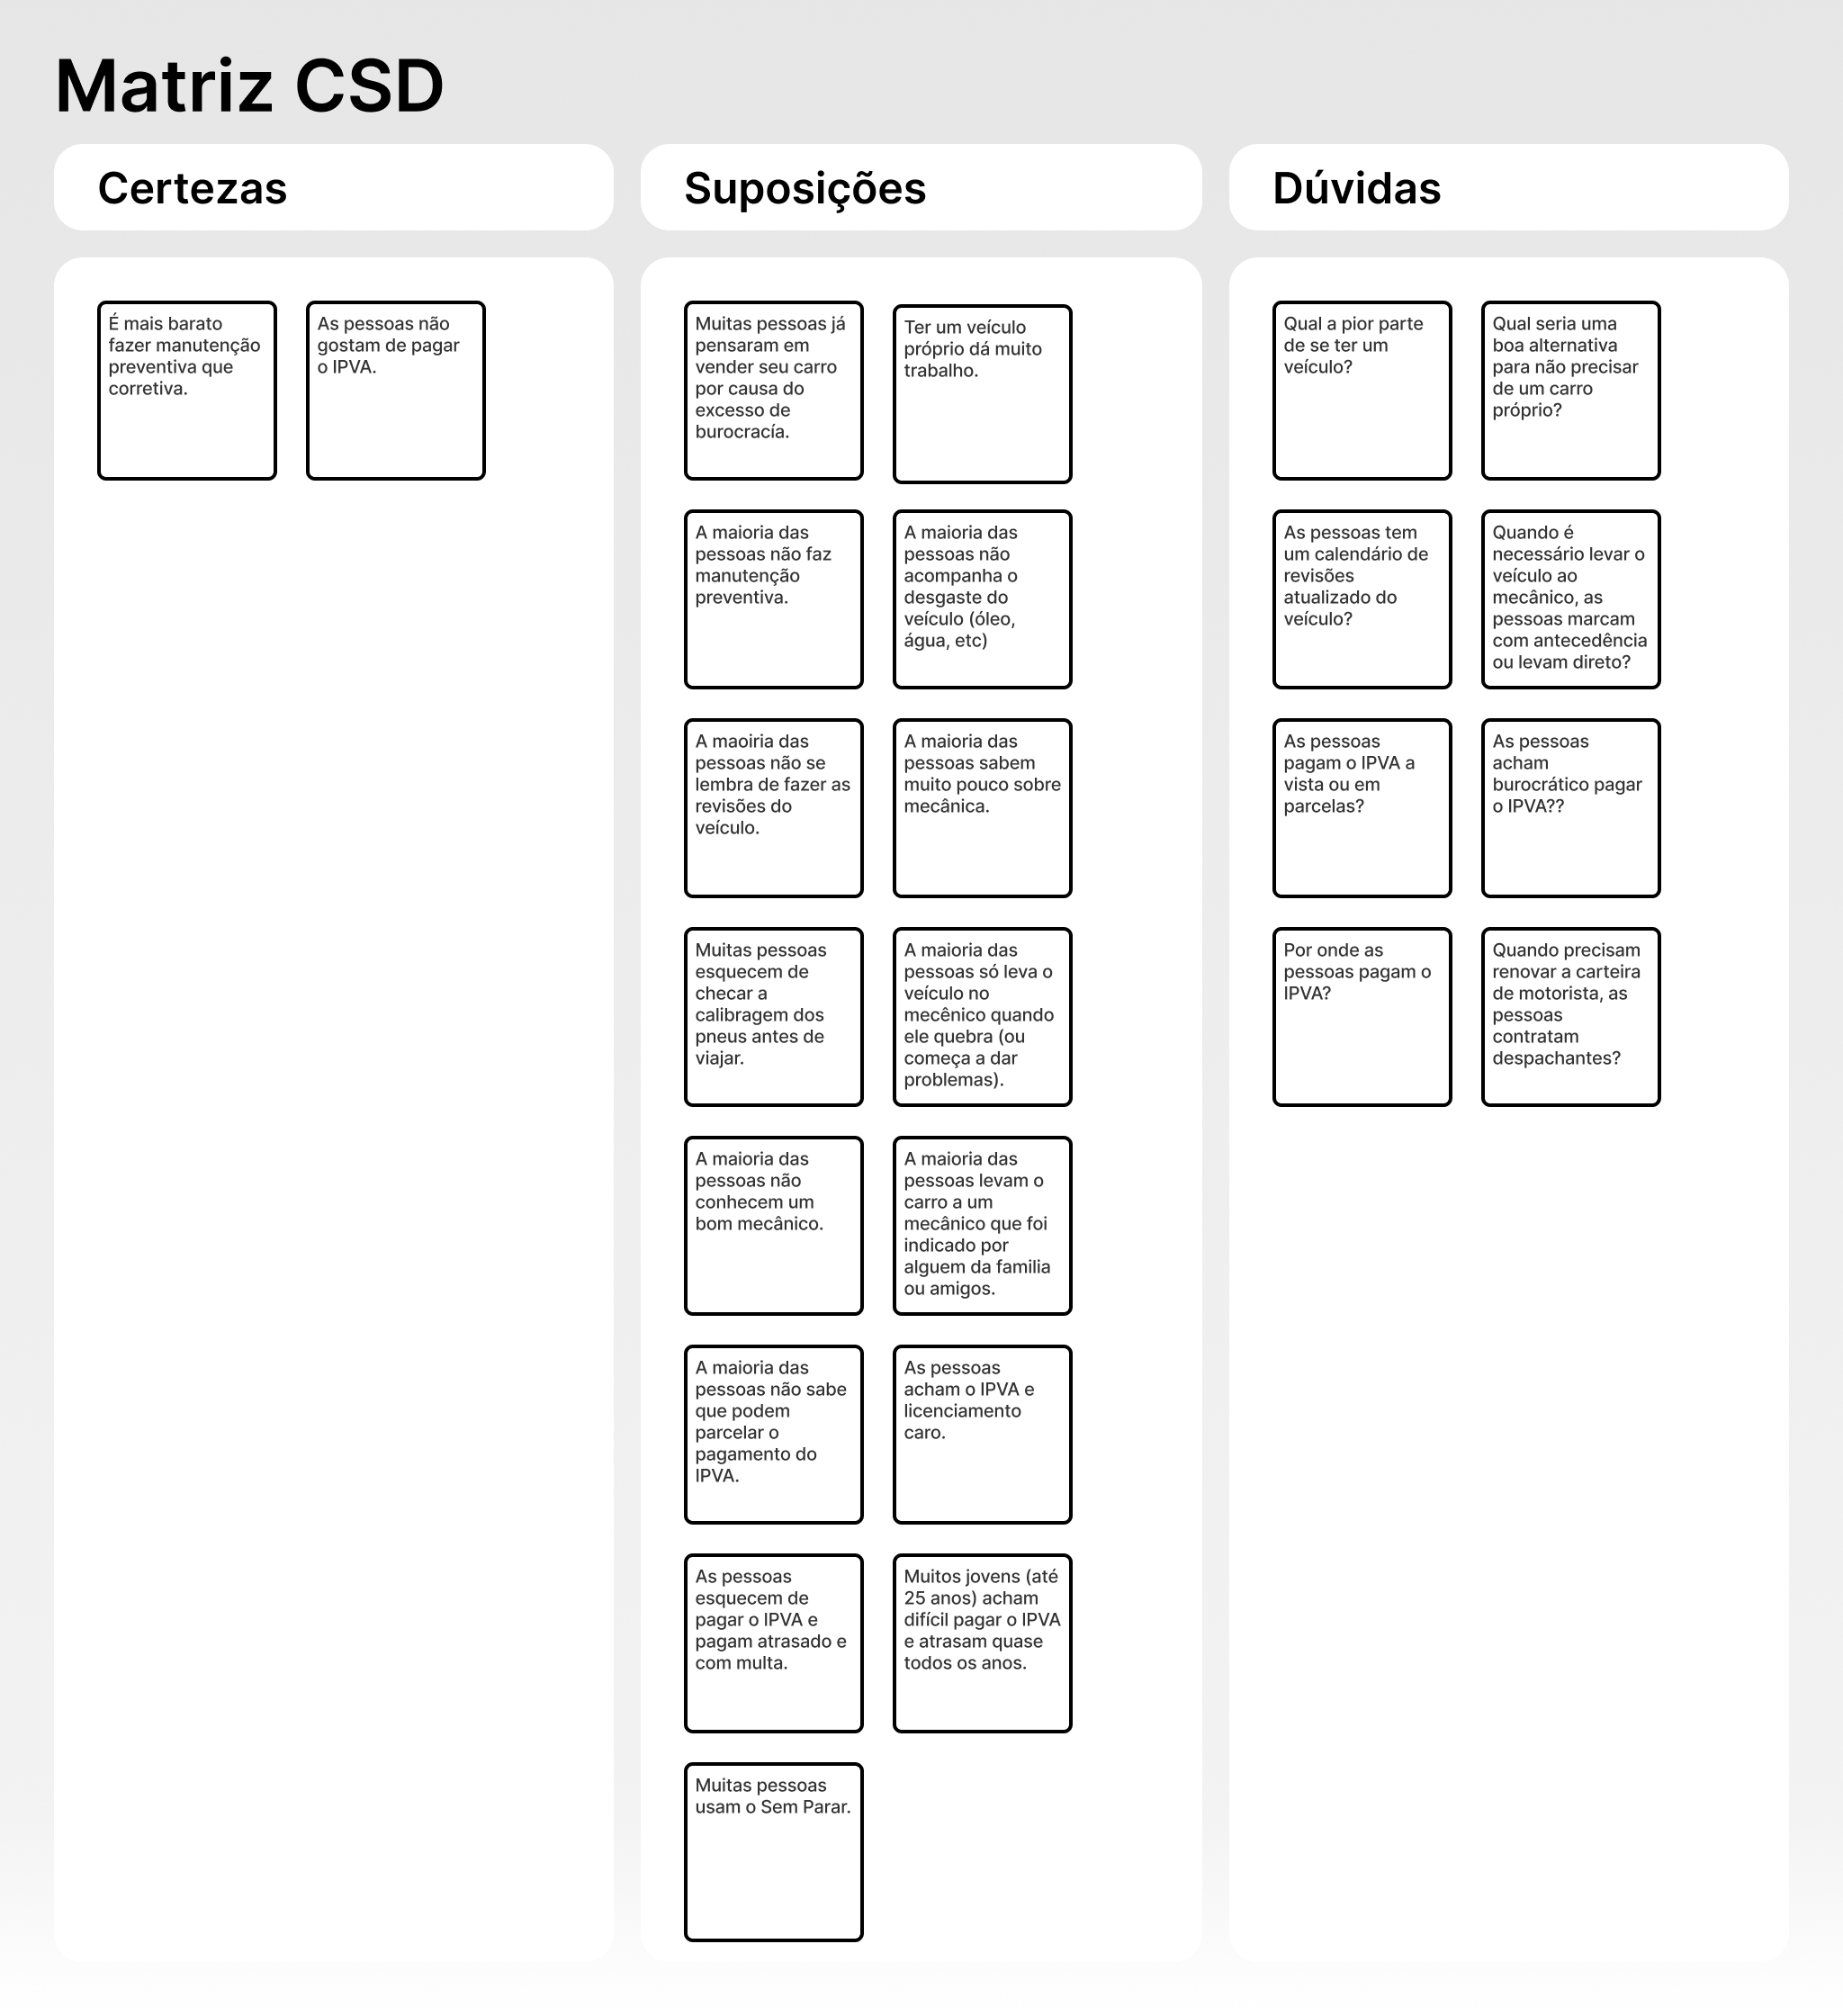
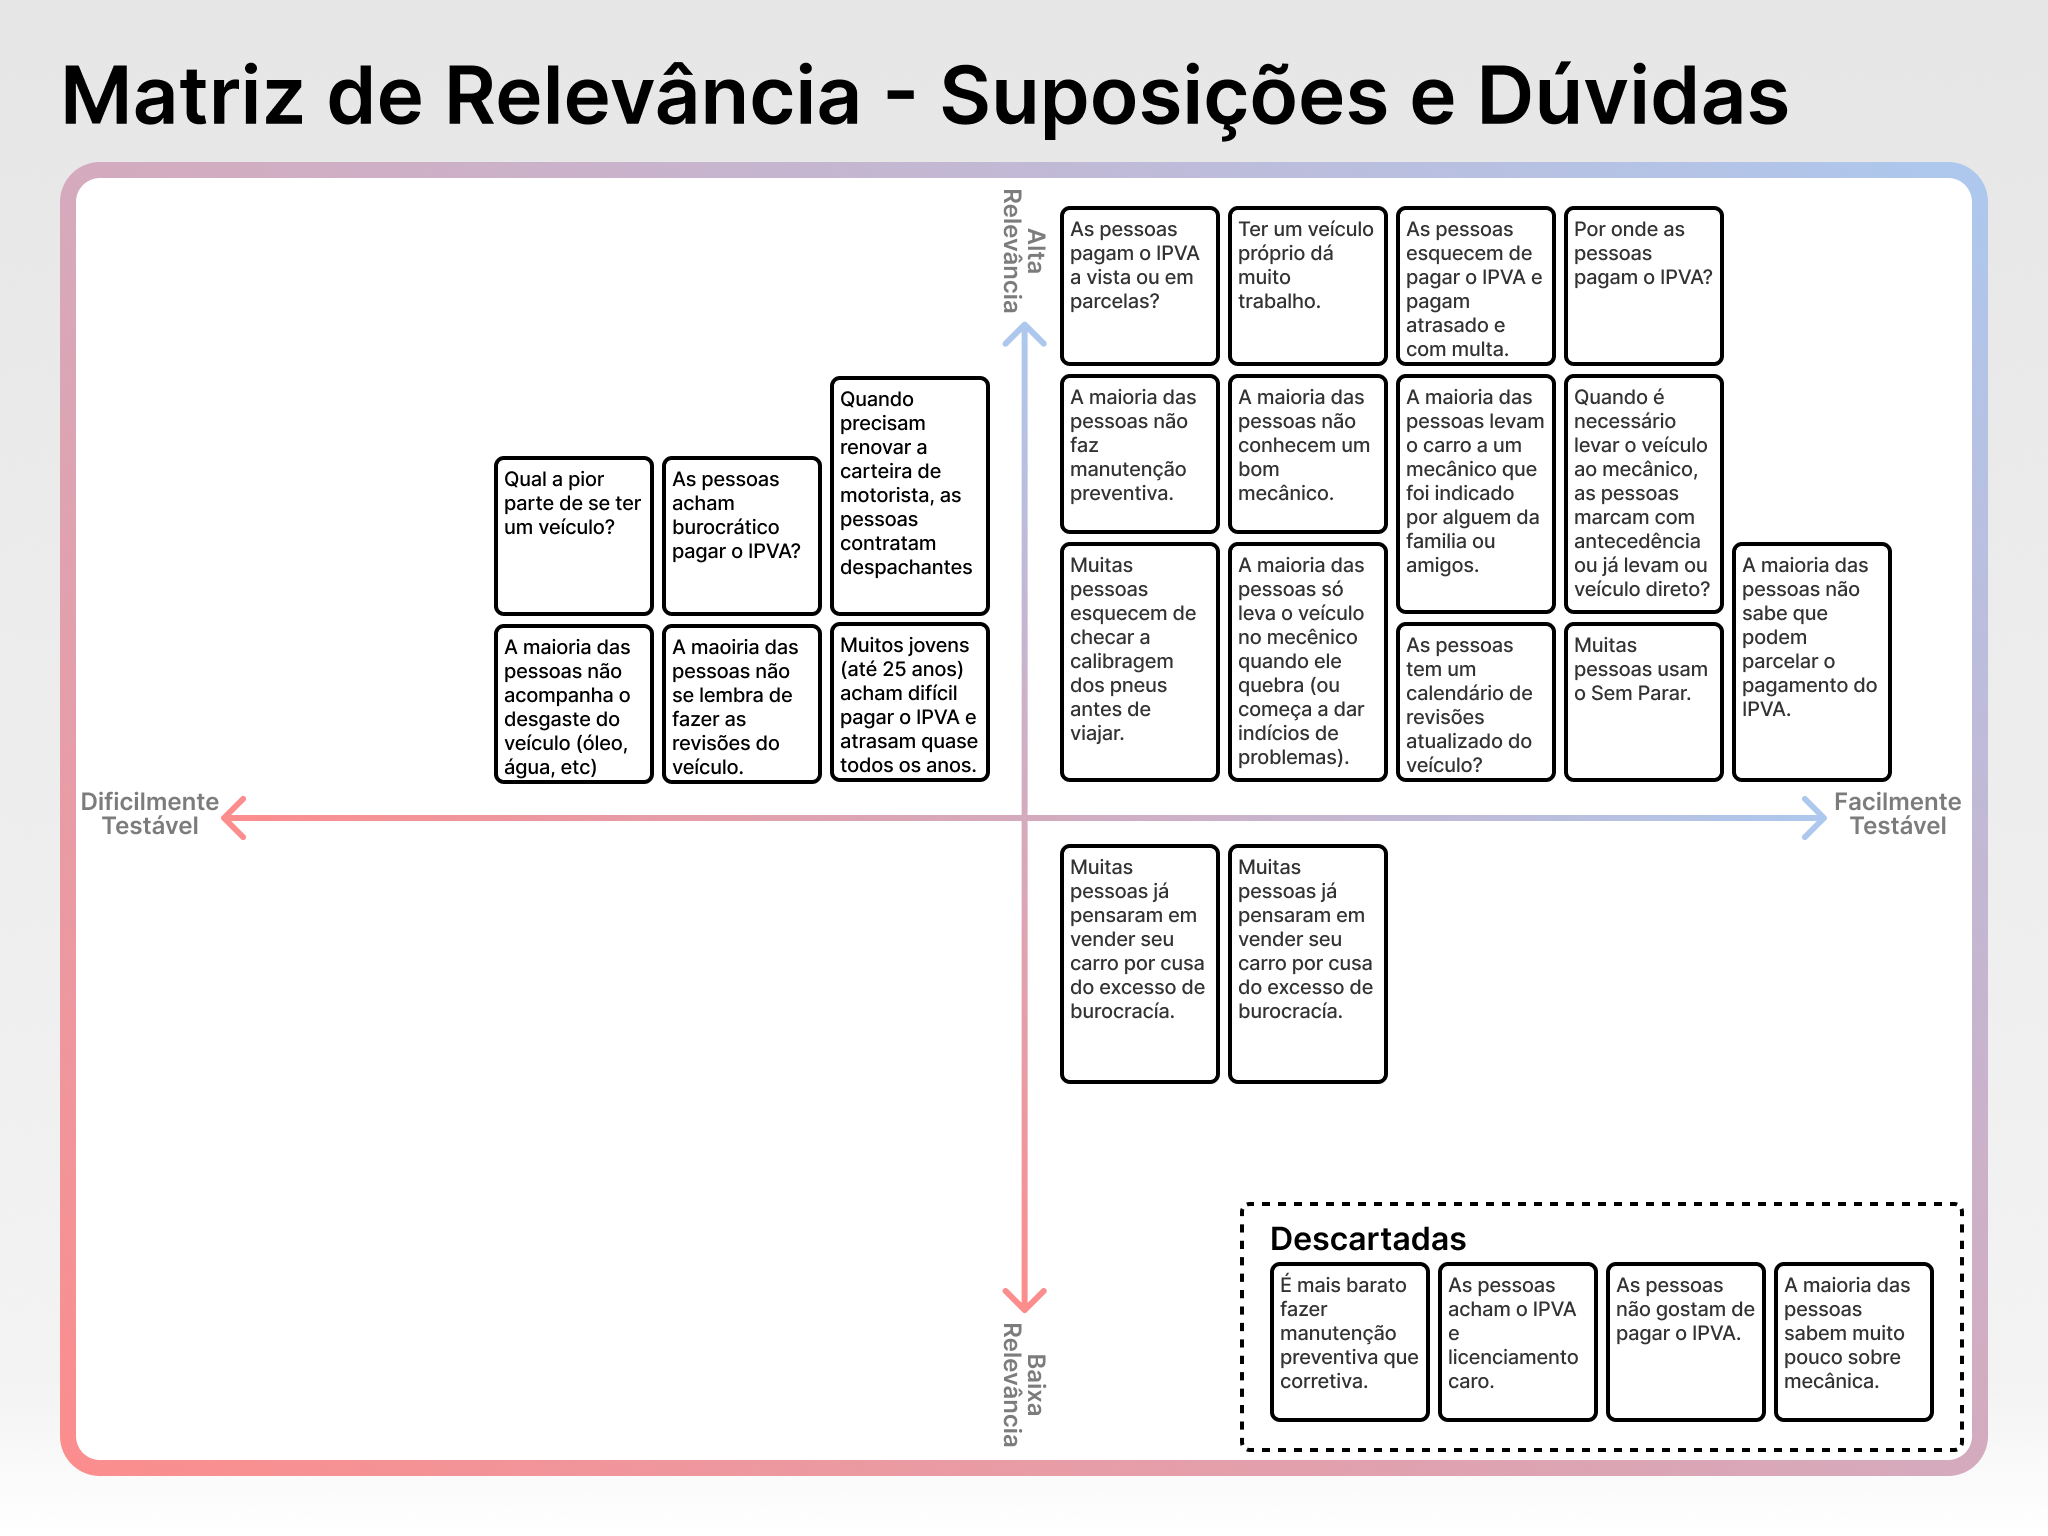
We started this step by creating a CSD Matrix in order to identify and visualize our hypotheses and doubts about the business and the user. Then we apply the hypotheses raised in a Matrix of relevance x validation difficulty, with the objective of prioritizing the knowledge that could be acquired more easily and identifying the hypotheses that would need more attention when being tested.
5.1 – Quantitative Research
We developed a questionnaire based on the hypotheses raised in the CSD Matrix for a stage of quantitative research focused on future users. The questionnaire had 28 multiple-choice questions, and was divided into four main parts.
Part 1 — Demographics with the objective of collecting data to identify specific niches for the solution, but without direct relevance to the research. In this part, any participant who was under 18 years of age or who did not own a vehicle was directed to the end of the survey and their data erased.
Part 2 — Issues related to how people pay their vehicle taxes.
Part 3 — Issues related to how people do their vehicle maintenance (overhauls), and how they deal with the parts of their vehicle that wear out naturally.
Part 4 — Issues that investigated hypothesis related to the business plan such as alternatives to owning a vehicle and possible indirect competitors.
Over a week 81 people responded to the questionnaire (not counting those who were eliminated in part 1). The results were then properly cleaned and analyzed so that they could answer the doubts and assumptions raised in the CSD Matrix.
From the data collected during the survey 17 main insights were identified:
- The vast majority of people pay their vehicle taxes in cash or in up to 3 installments.
- The vast majority of people pay their vehicle taxes through their bank’s app (or internet banking).
- Most people do not delay paying their vehicle taxes, or if they have, it has only happened a few times.
- Most people don’t know that they can pay their vehicle taxes in 12 installments on their credit card.
- Most people don’t find the process of paying their vehicle taxes complicated.
- The 19-25 age group of vehicle owners tend to be almost twice as late in paying their vehicle taxes and find the payment process difficult almost three times as often.
- Most people do preventive maintenance on their vehicle every 6 months or 10 thousand km, but 26% of people forget to do it, which shows that there is a difficulty for many users in this regard.
- The main reasons people don’t do preventive maintenance on their vehicles are they don’t have time for it and they think it’s too expensive.
- Most people take their car to a trusted mechanic shop, and the main reasons that lead them to build this trust are good prior service and recommendation from friends and family.
- Most people call ahead to let them know that they are going to take the vehicle in for a quote or simply go to the auto repair shop directly.
- Most people are in the habit of checking the tire pressure and the condition of other items of normal wear and tear once a week or when going on a long trip.
- The number of people who have a review calendar is pretty close to the number who don’t.
- The vast majority of people think that having a vehicle is cumbersome and bureaucratic.
- For 45% of participants, the worst part of owning a vehicle is the price of fuel. Vehicle taxes are considered the worst part for 37% of people.
- Urban mobility apps like Uber, Bla Bla Car as well as public transport are popular alternatives for those who no longer want their own vehicles. We also see options like car rental and even bicycles appearing as good alternatives as well.
- Most people use or have used automatic toll payment services.
- The vast majority of people do not use the services of vehicular dispatchers.
5.2 – Qualitative Research
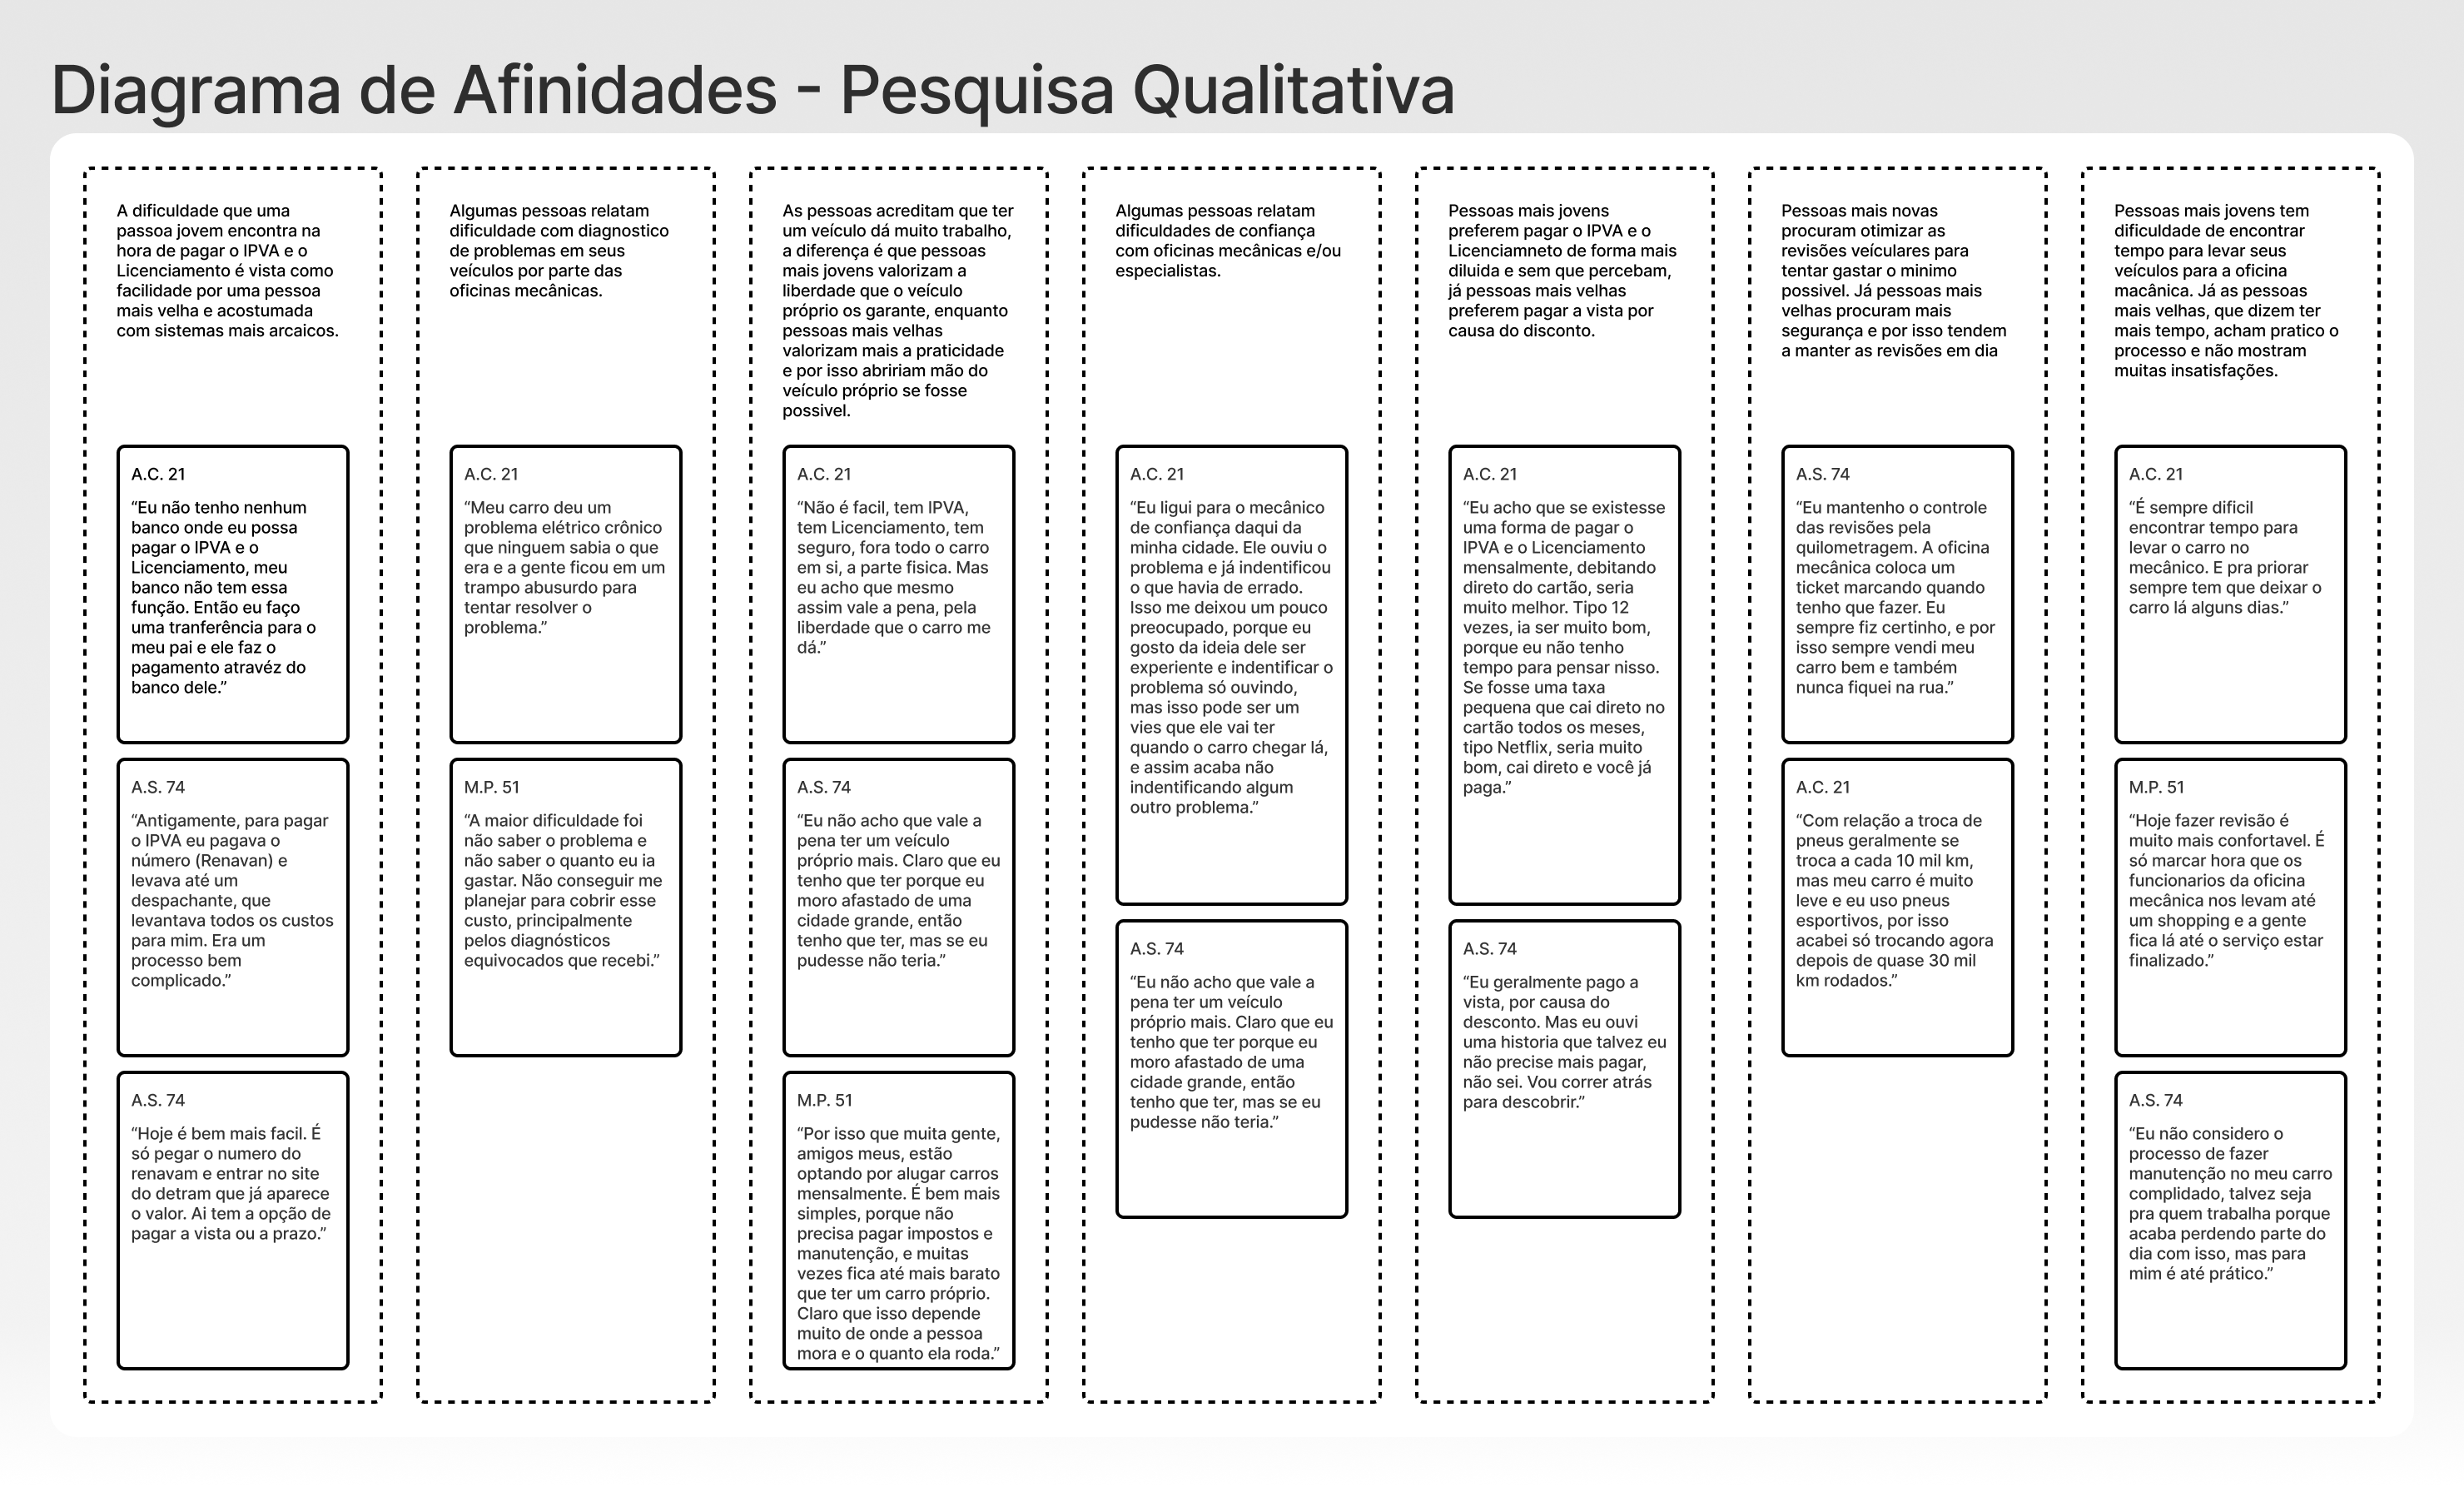
After completing the quantitative research stage using the questionnaire, we decided to proceed to a stage of qualitative research in order to seek deeper insights. We carried out in-depth interviews with five participants with the aim of delving deeper into their pain and needs.
The interviews were semi-structured and followed a basic logic with the objective of letting the participant go deeper into the related subjects and bring up facts that they thought were relevant. The structure was very basic: After the Set Up and the Introduction, we asked a general question about the participant’s first car/motorbike, with the objective of opening the interview and encouraging the participant to remember affective memories. After that the interview could be directed to any of the relevant topics like vehicle taxes, maintenance or other vehicle issues. Many of the questions in this main part of the interview were very similar to the questionnaire questions, but had a more open and in-depth direction, which would serve both to validate and to understand the reason for the questionnaire responses. After completing all these points, the interview would end.
All interviews were recorded and transcribed into text, and then coded into patterns using Affinity Diagrams.
5.3 – Research Results
After the research stage, many learnings surprised us, but perhaps none as much as what we discovered when we crossed the insights with the demographic data collected in the quantitative research: The younger the participant, the more difficulty and frustration he has in relation to the current way of being pay taxes and do vehicle maintenance. This is especially true for the 19 to 25 age group, who demonstrate proportionately greater difficulty than other age groups. Because of this research insight, we decided to focus our solution on this age group, thus creating a product with a specific niche.
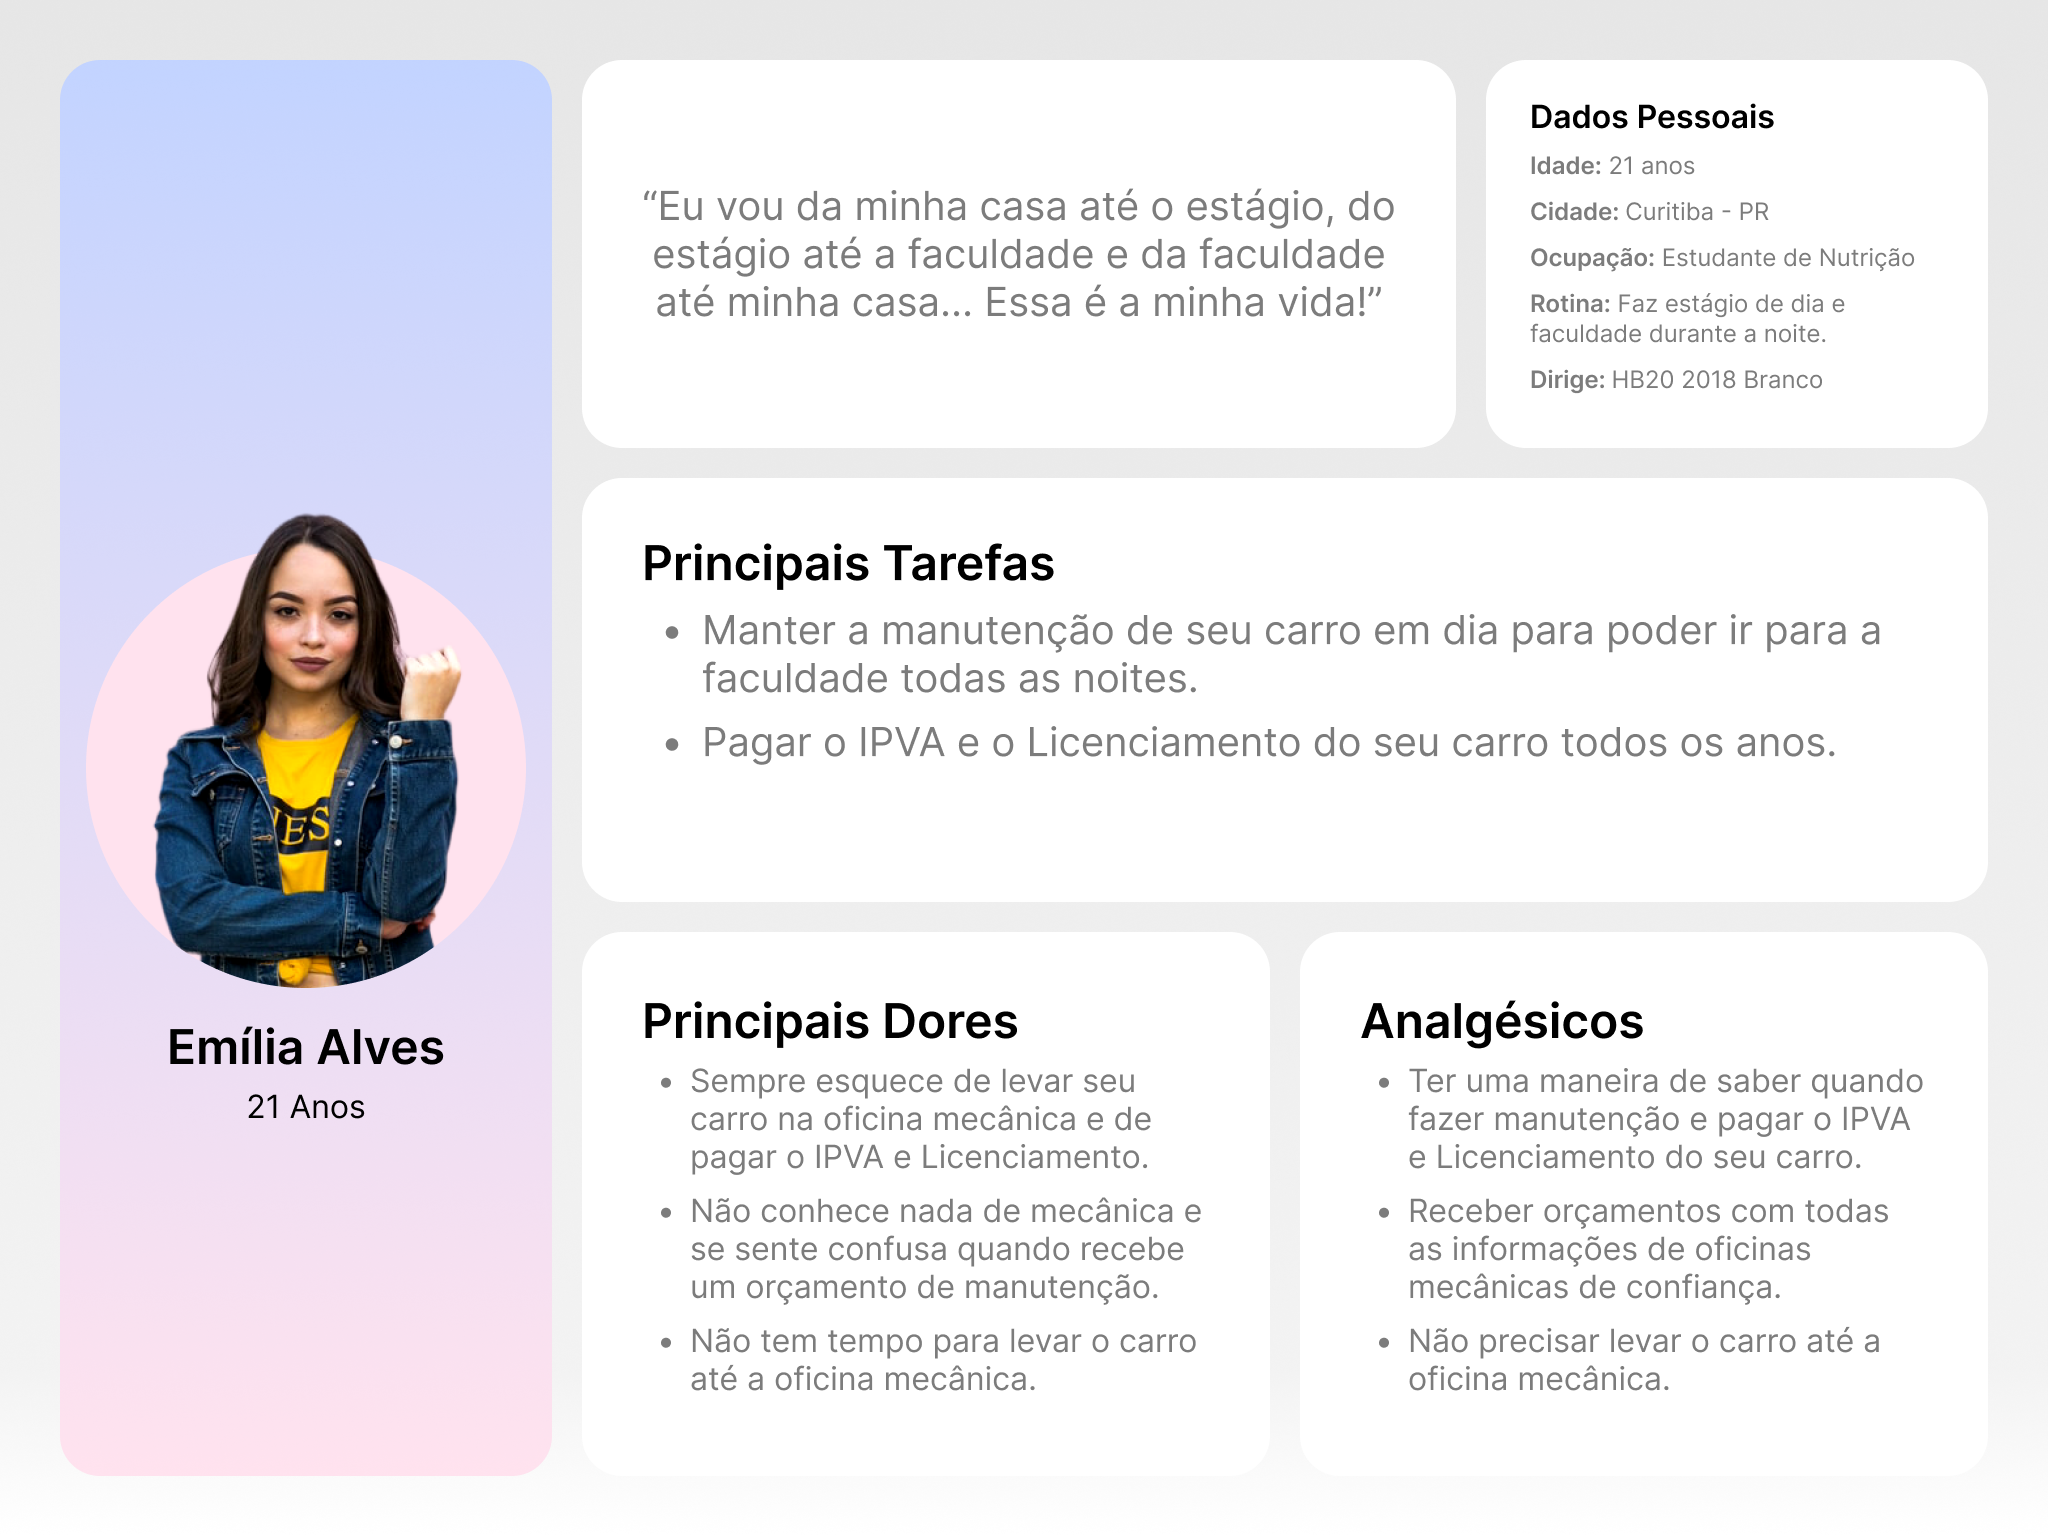
6 – Persona and User Journey Maps
Before proceeding to the ideation stage, we decided to express our learnings in the research stage. For this we validate our proto-personas and from them we create our user journeys. As mentioned before, we also decided to focus on the 19 to 25 age group, as we found (through research) that this group is the one that faces the greatest difficulties when managing their vehicles.
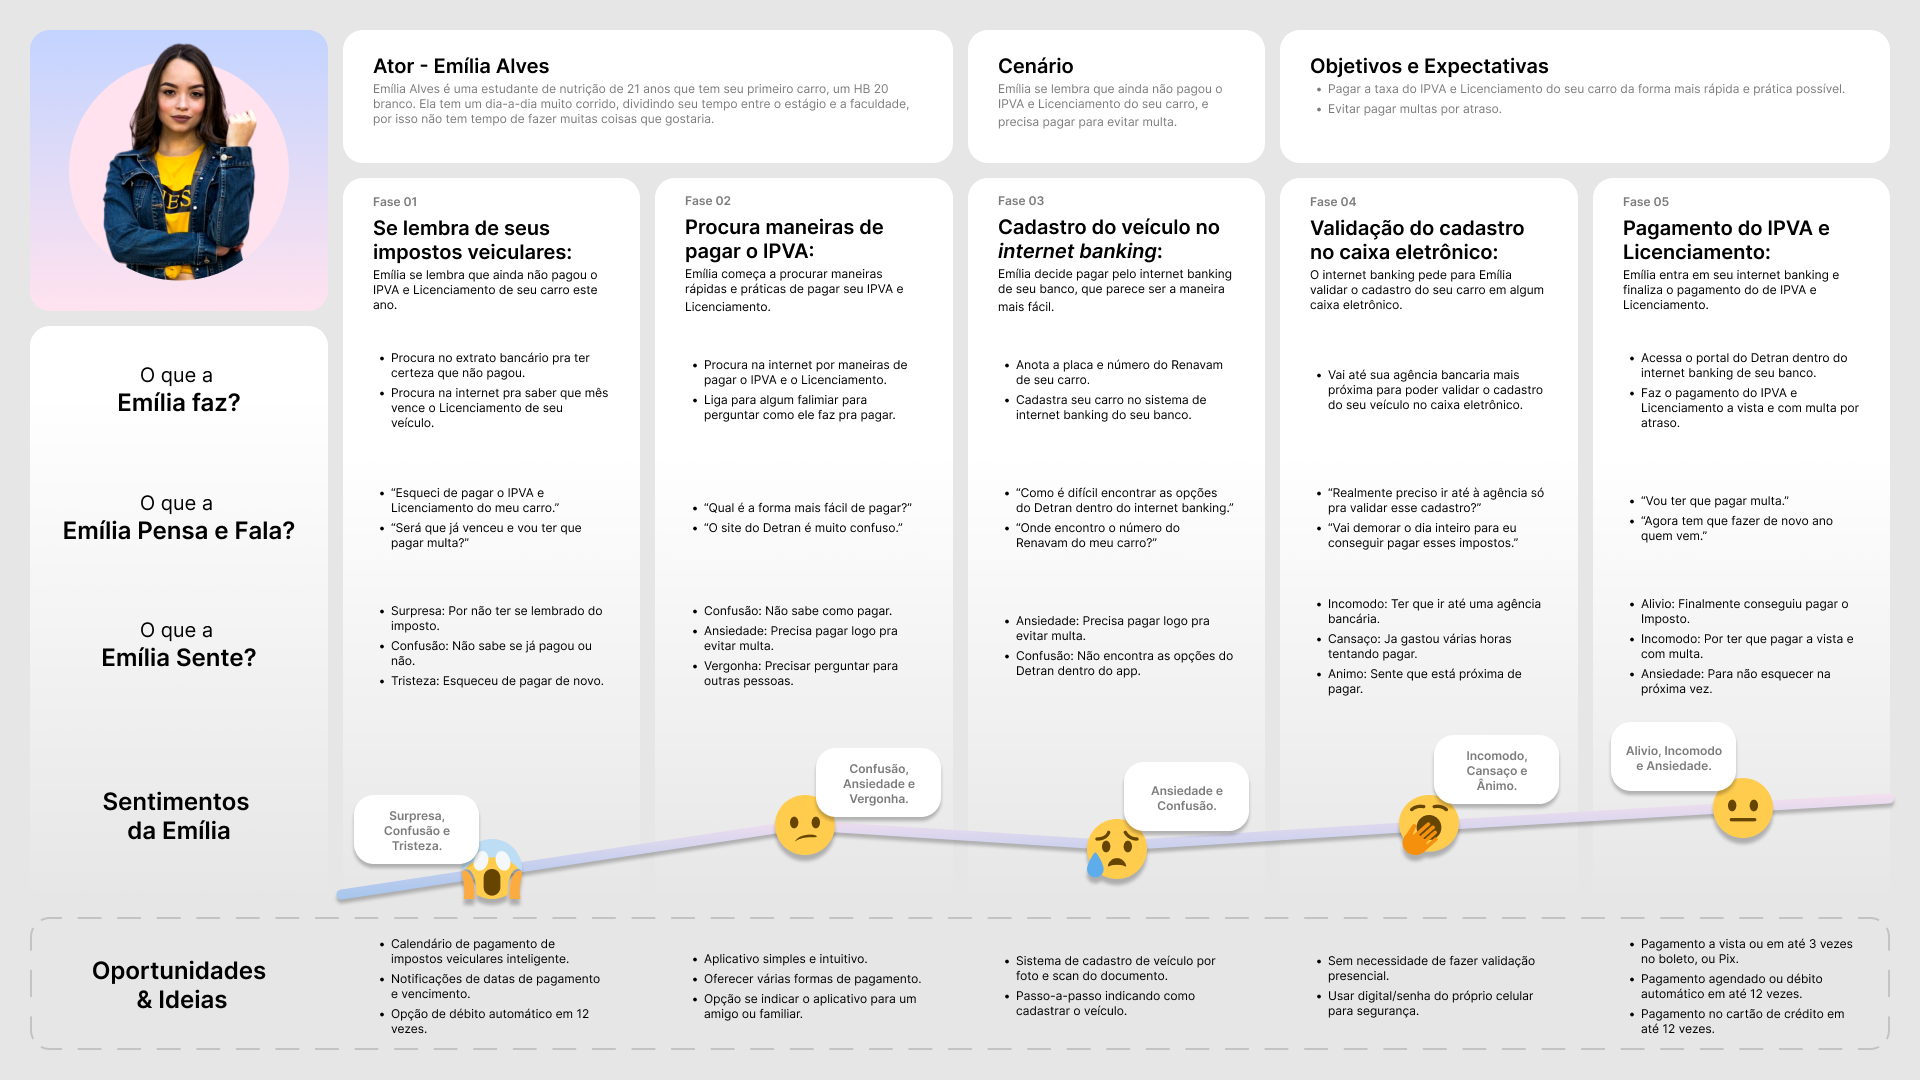
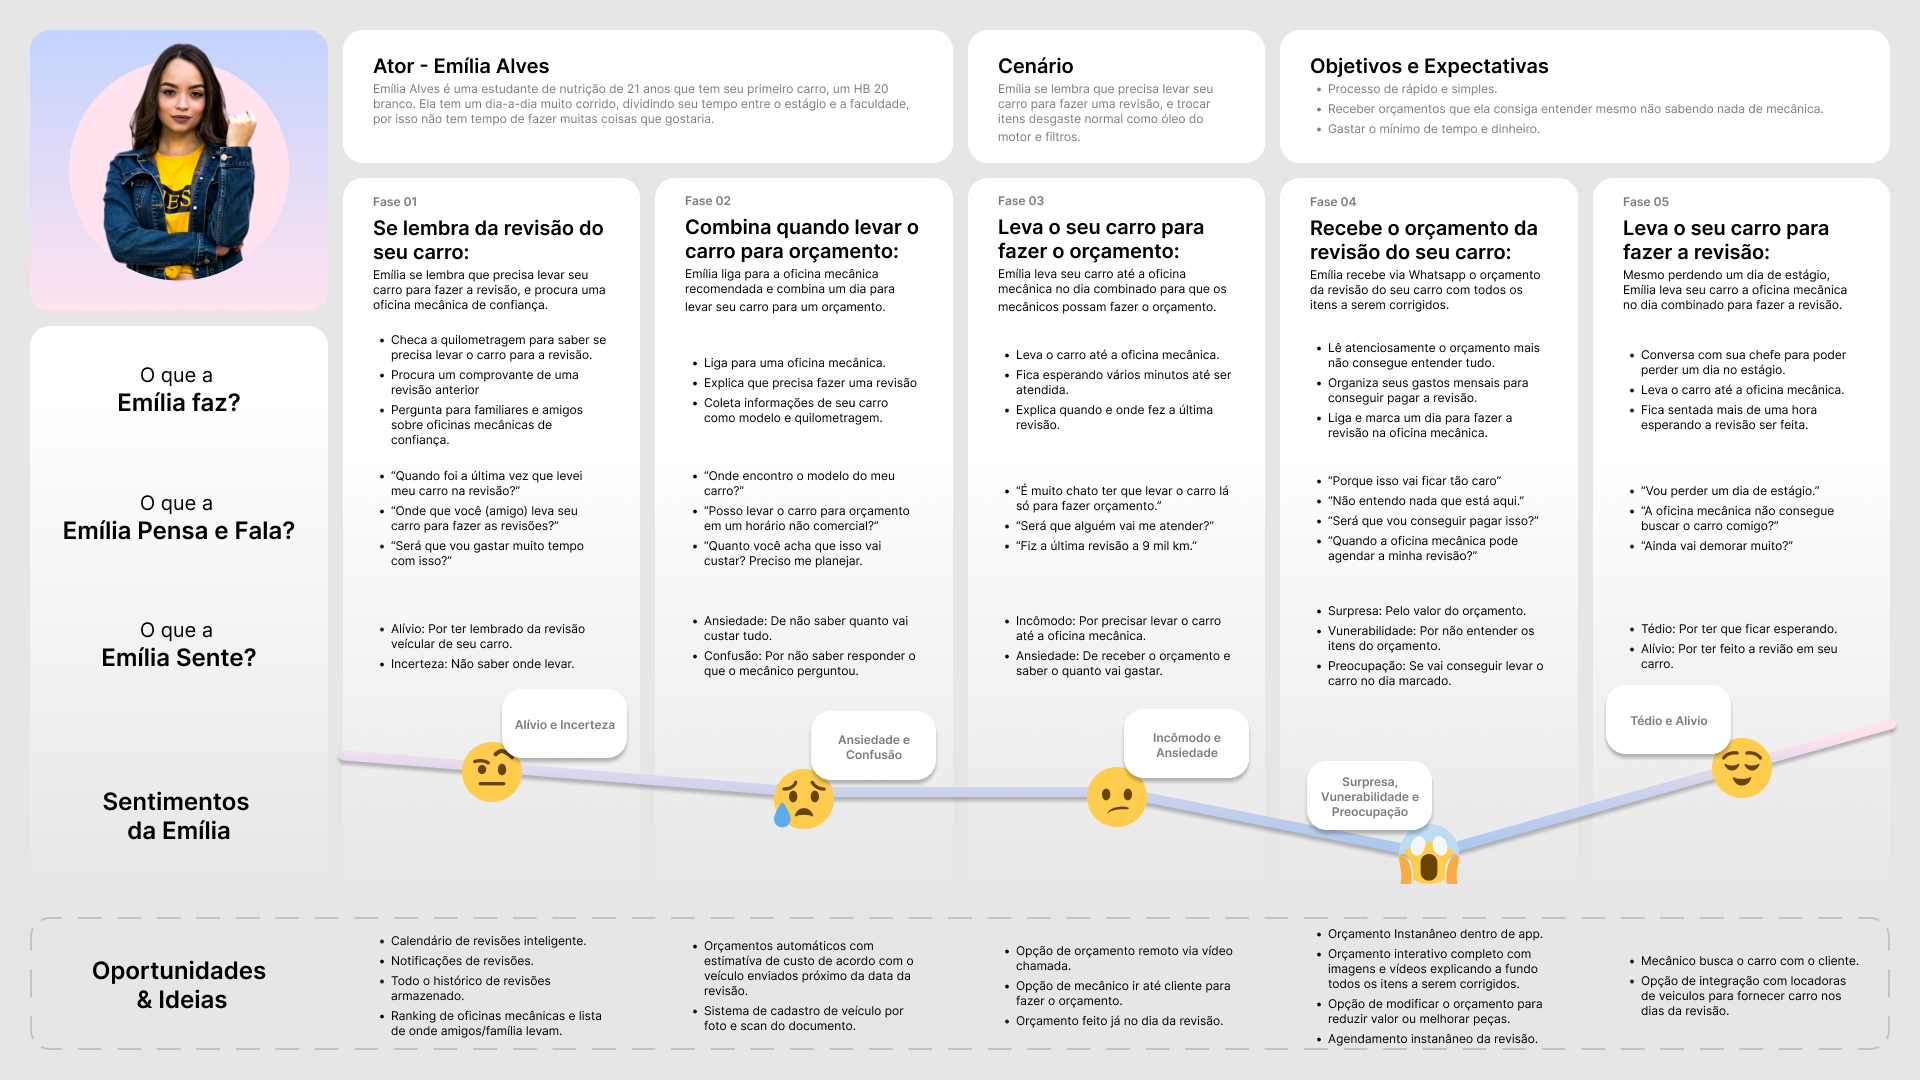
We also created user journeys for our persona, thus mapping two of the main tasks of any vehicle owner, inspections and paying taxes, in addition to their pains in the process. At this stage, we have already started to identify some opportunities.
The conclusion we reached at this stage is that even though there are already solutions that meet the user’s needs, they focus on just a few elements of the vehicle owner’s day-to-day life and do not yet offer automation features, requiring a lot of effort on the part of the user to keep the solution up to date.
7 – Ideation and Prioritization
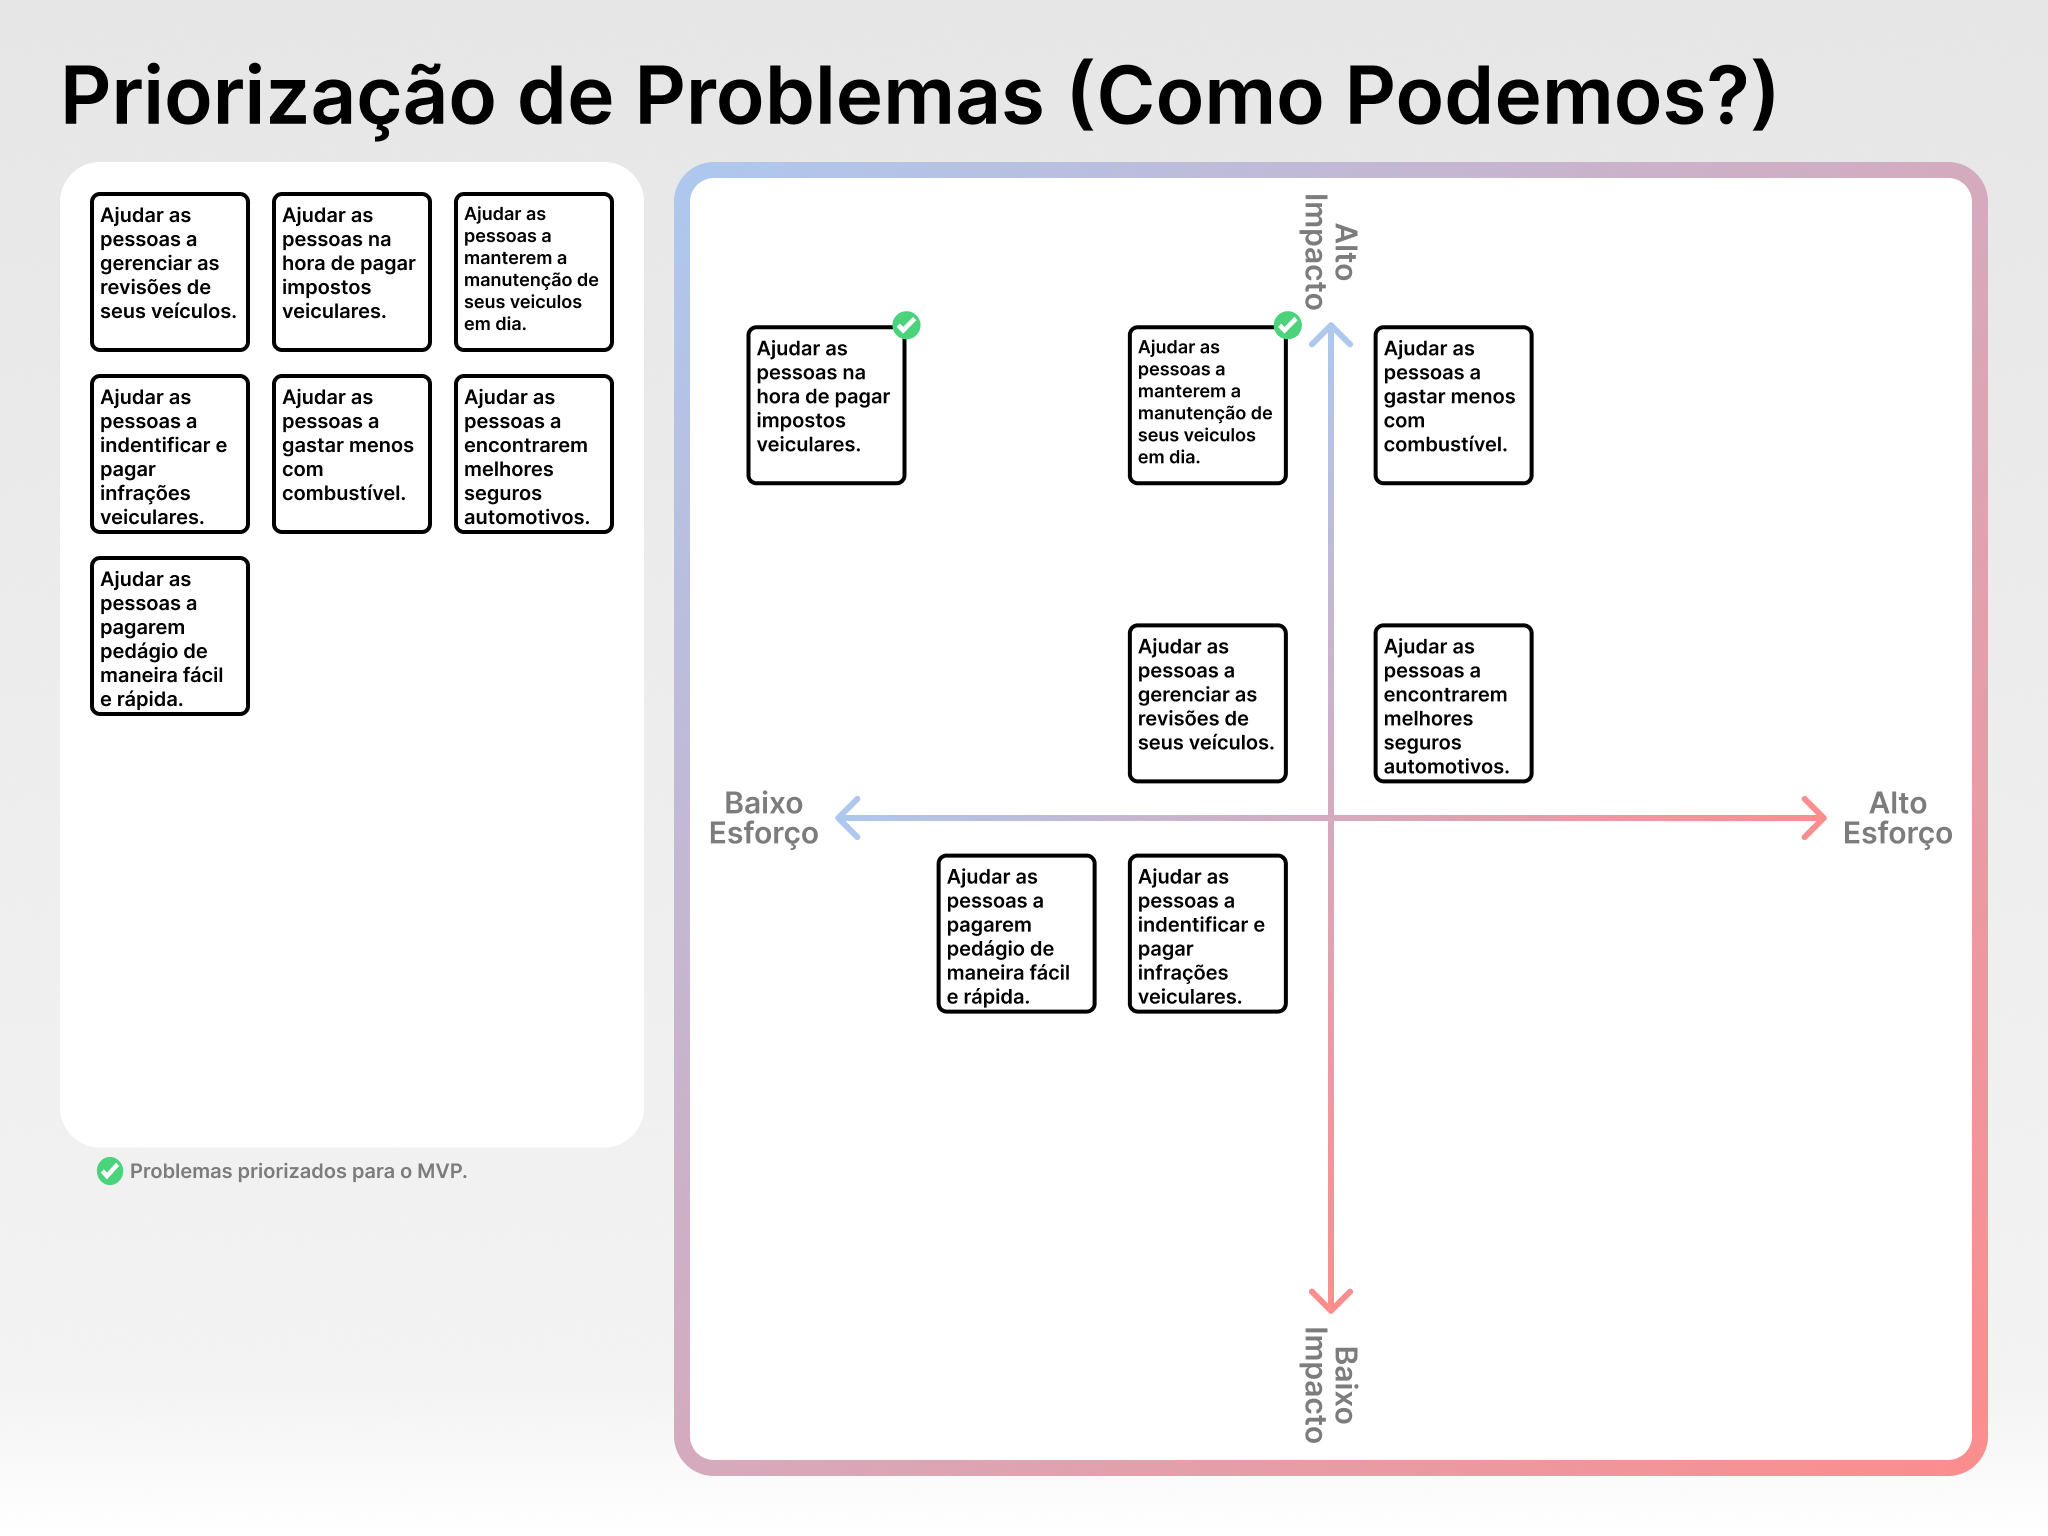
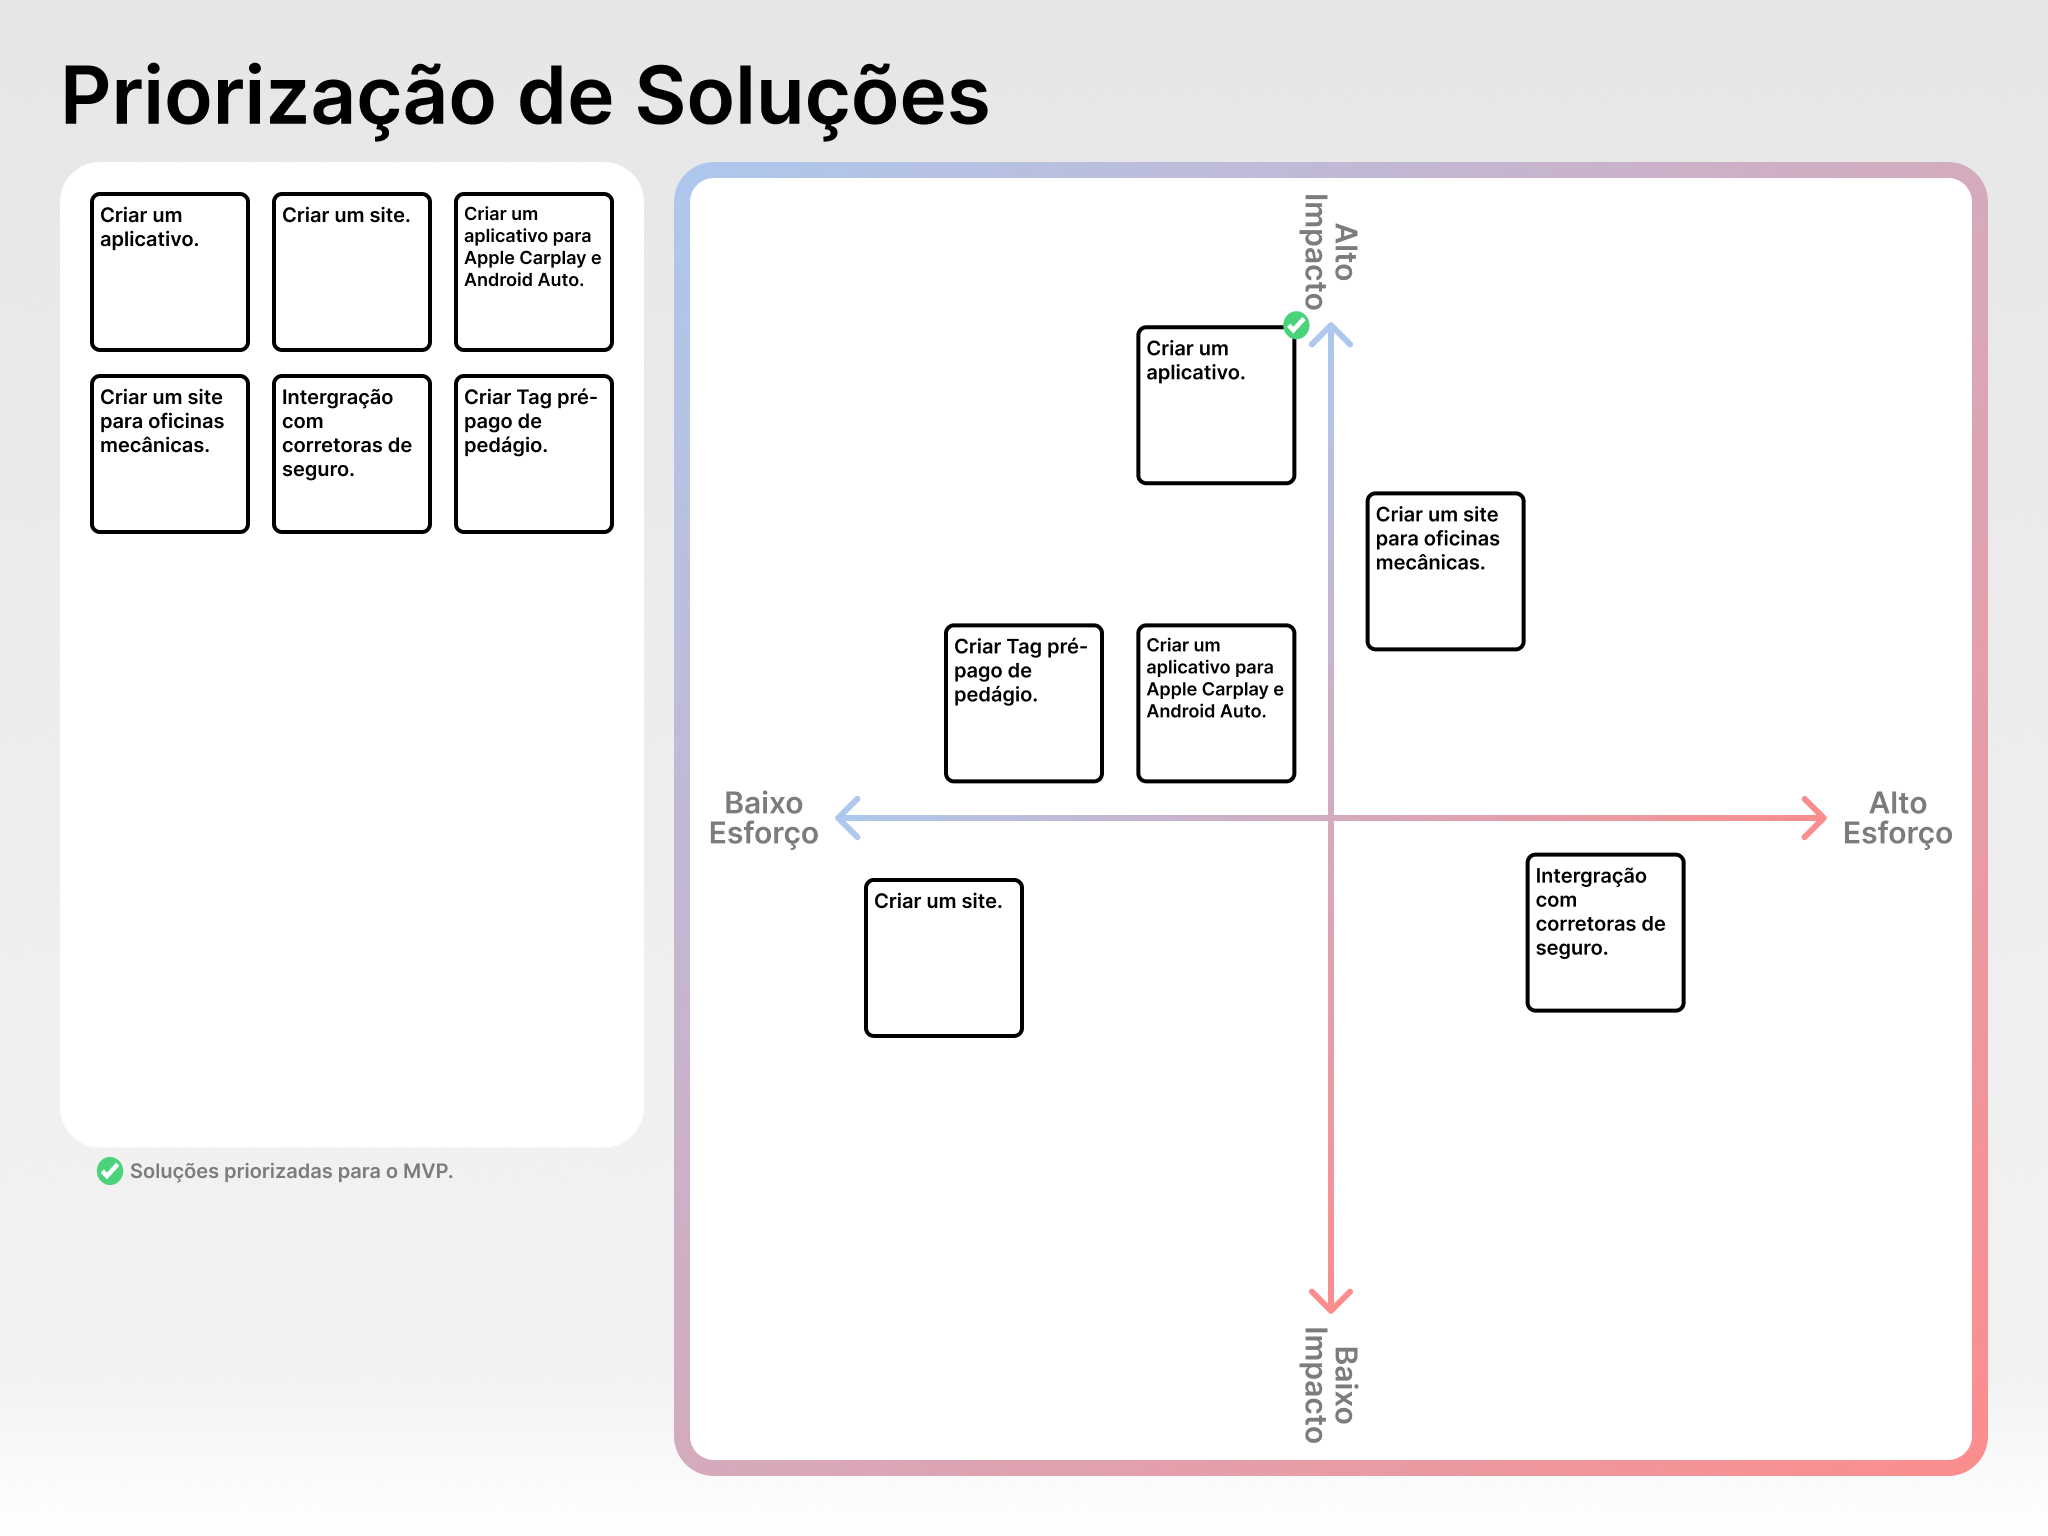
After we had a solid understanding of the user and validated the business plan, we moved on to the ideation stage. In this step, we discussed the relevant problems that could be solved (How Might We), possible solutions, and functionalities that the chosen solution would have. And to better define the path to be followed, we carried out a series of prioritization exercises.
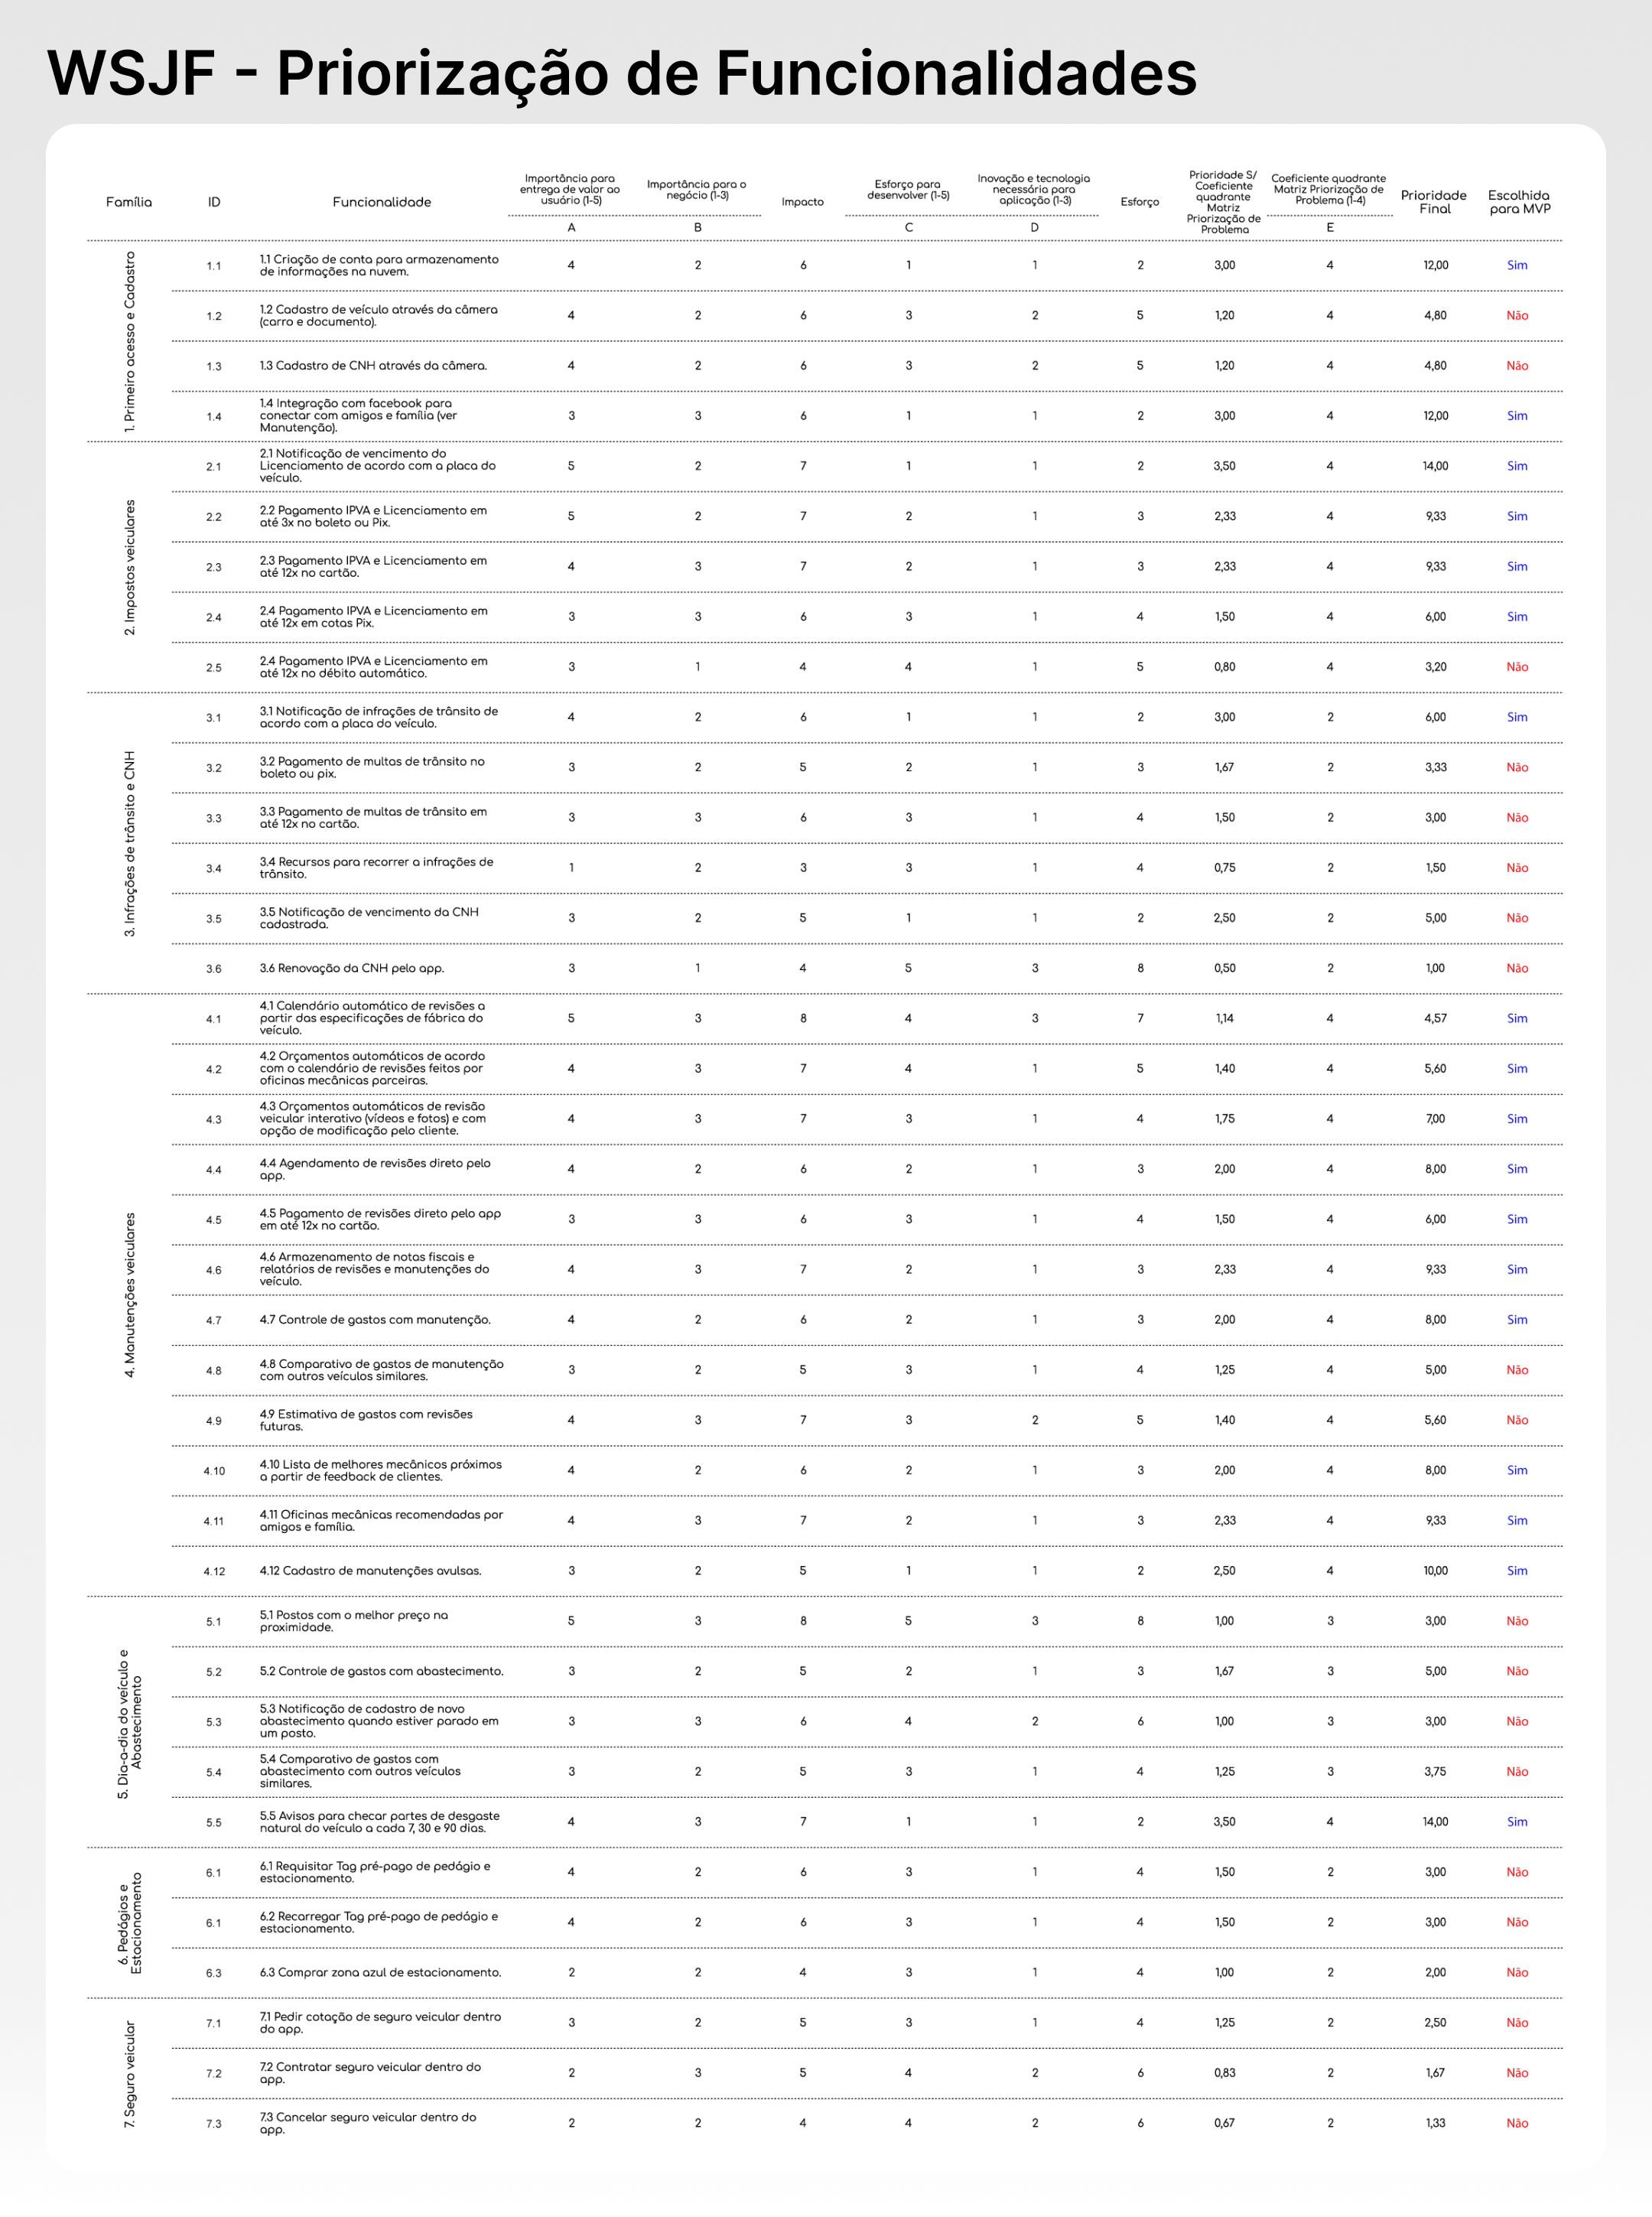
We made Impact x effort matrices to prioritize the problems (How Might We) and the solutions, and to prioritize the features we used the WSJF technique in a simplified way to be able to deal with the large number of features listed. We prioritized functionality by dividing scores of Importance for delivering value to the user (grade 1–5) and Importance for the business (grade 1–3) by Effort to develop (grade 1–5) and Innovation and technology required for application (grade 1 –3). After that, we multiplied a coefficient from the quadrant of the Problem Prioritization Matrix (grade 1–4) so that the features that addressed already prioritized problems would increase in value. We decided to develop our MVP with the features that scored more than 6 or that were extremely important for delivering value to the user.
The conclusion we reached at this stage is that even though there are already solutions that meet the user’s needs, they focus on just a few elements of the vehicle owner’s day-to-day life and do not yet offer automation features, requiring a lot of effort on the part of the user to keep the solution up to date.
8 – Designing the app
8.1 – Hand-drawn canvases
After defining that the solution would be an app and the list of its features, we proceed to hand drawing it. We started by doing Crazy-8 exercises to generate ideas quickly and proceeded to draw a single user flow completely.
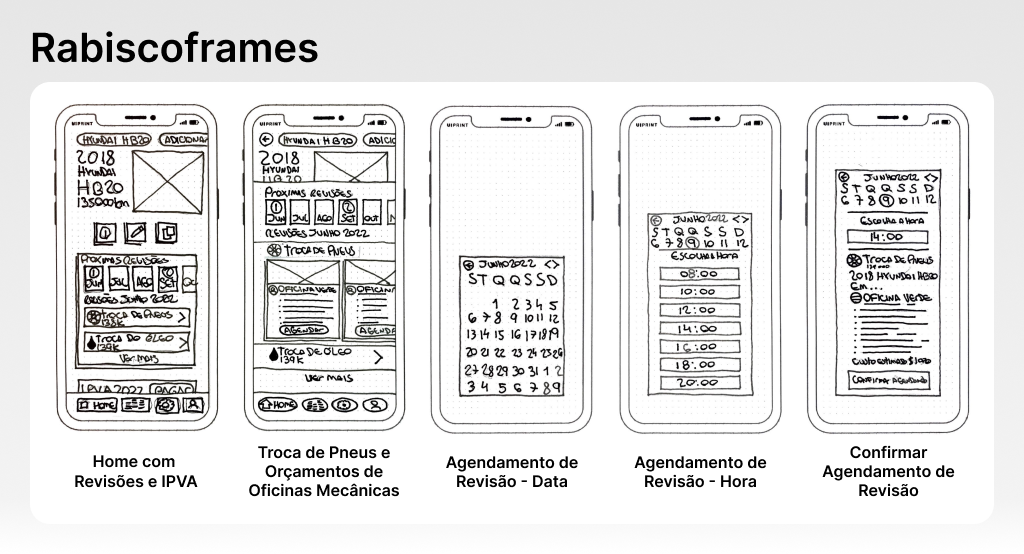
With the hand drawings in hand, we started to think about how the flow inside the application would be.
8.2 – Low-fidelity prototype and User Testing
Following the Lean Ux methodology, we decided to use the hand drawing screens to carry out initial usability tests. We scanned the sketches and brought them into the Figma where we created a prototype focusing only on the part of vehicle maintenance. With this low-fi prototype we did some usability tests with people close to us. The mission was simple: Can you schedule a tire change at the green mechanic shop at 2 pm on June 9 within the app?
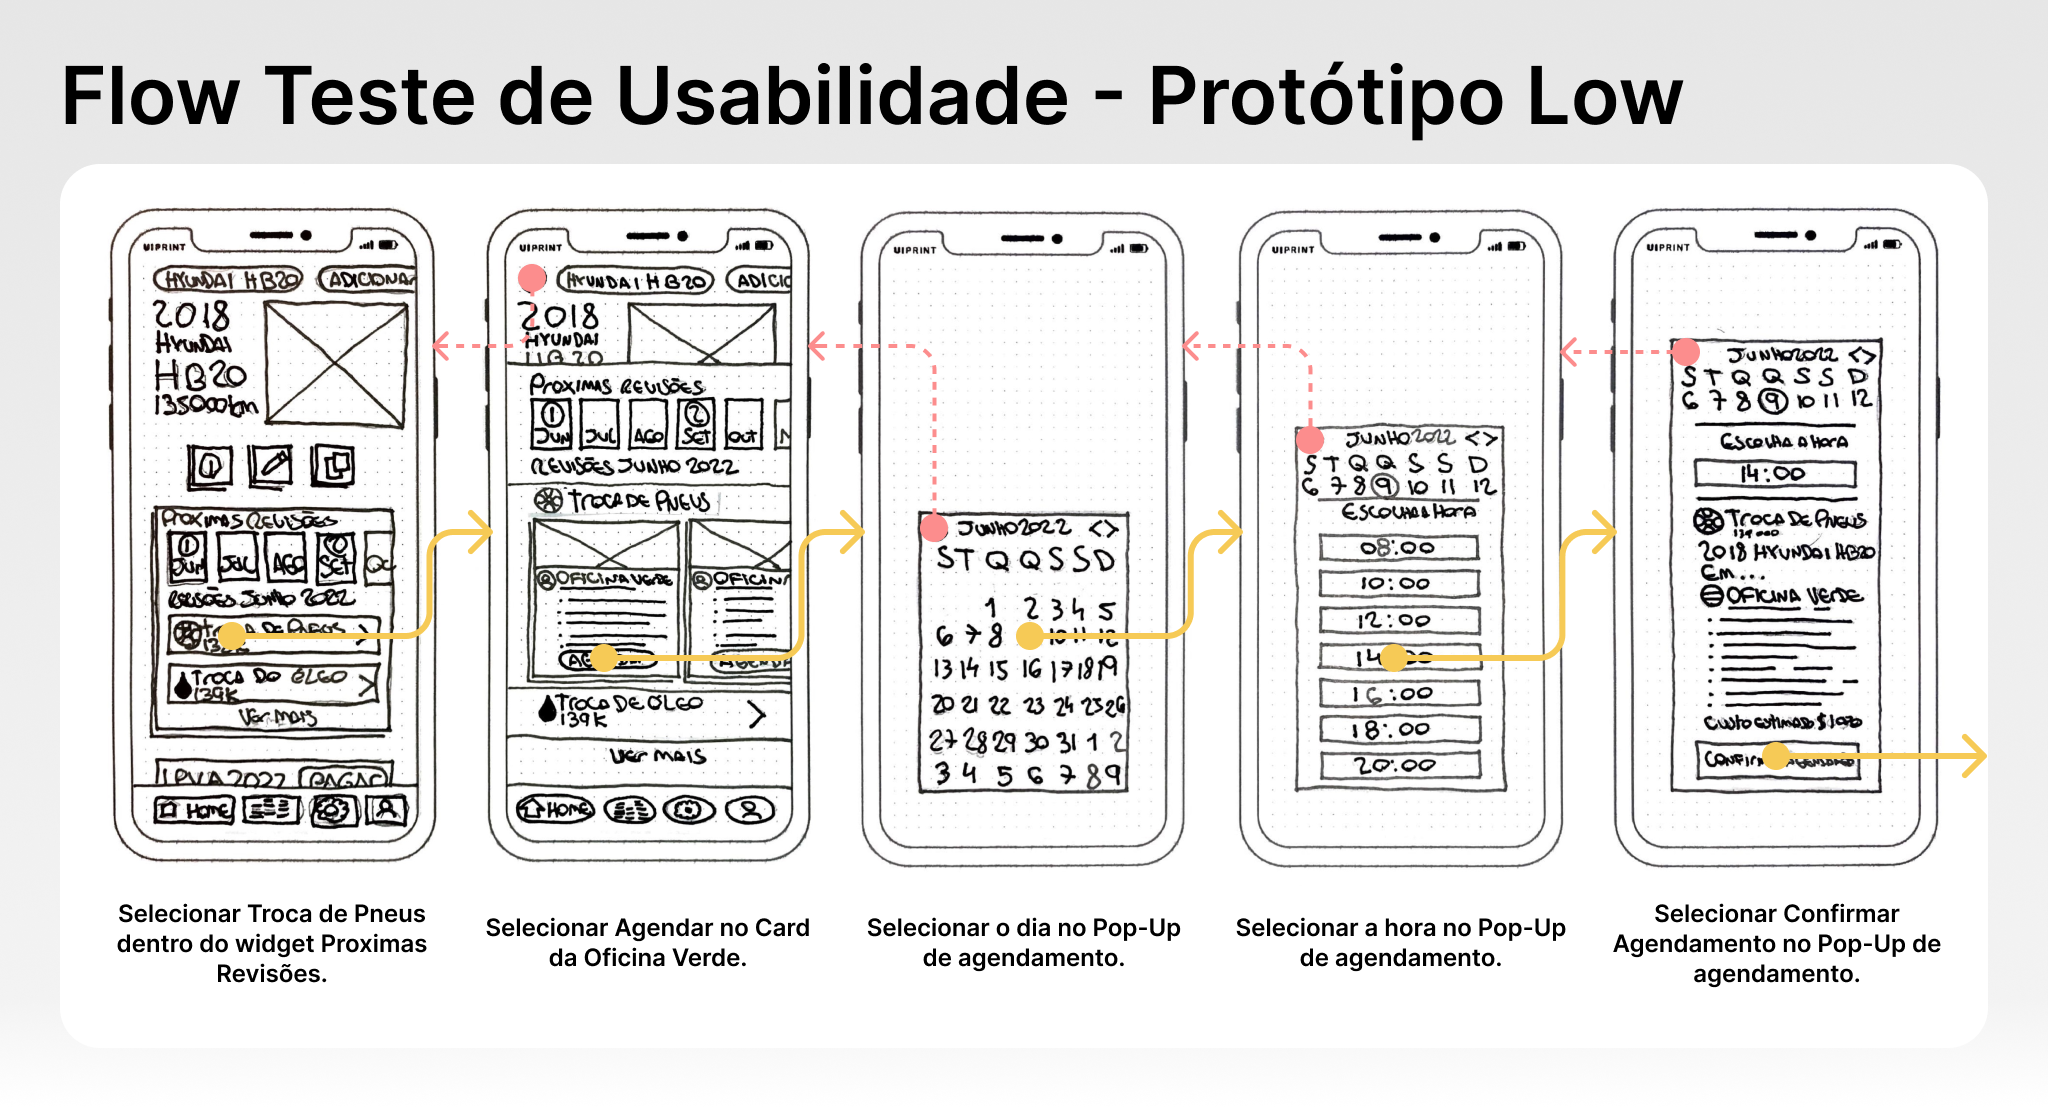
After testing the prototype with 5 people, we realized that even though the vast majority of them did not have great difficulties with the interface, they were unable to complete the test due to difficulty reading the texts that had been written by hand. Some of them also reported that they found the home screen to be very complicated, but they liked the scheduling process. Based on this information, we decided to go ahead and develop another prototype so that we could do more elaborate and accurate tests.
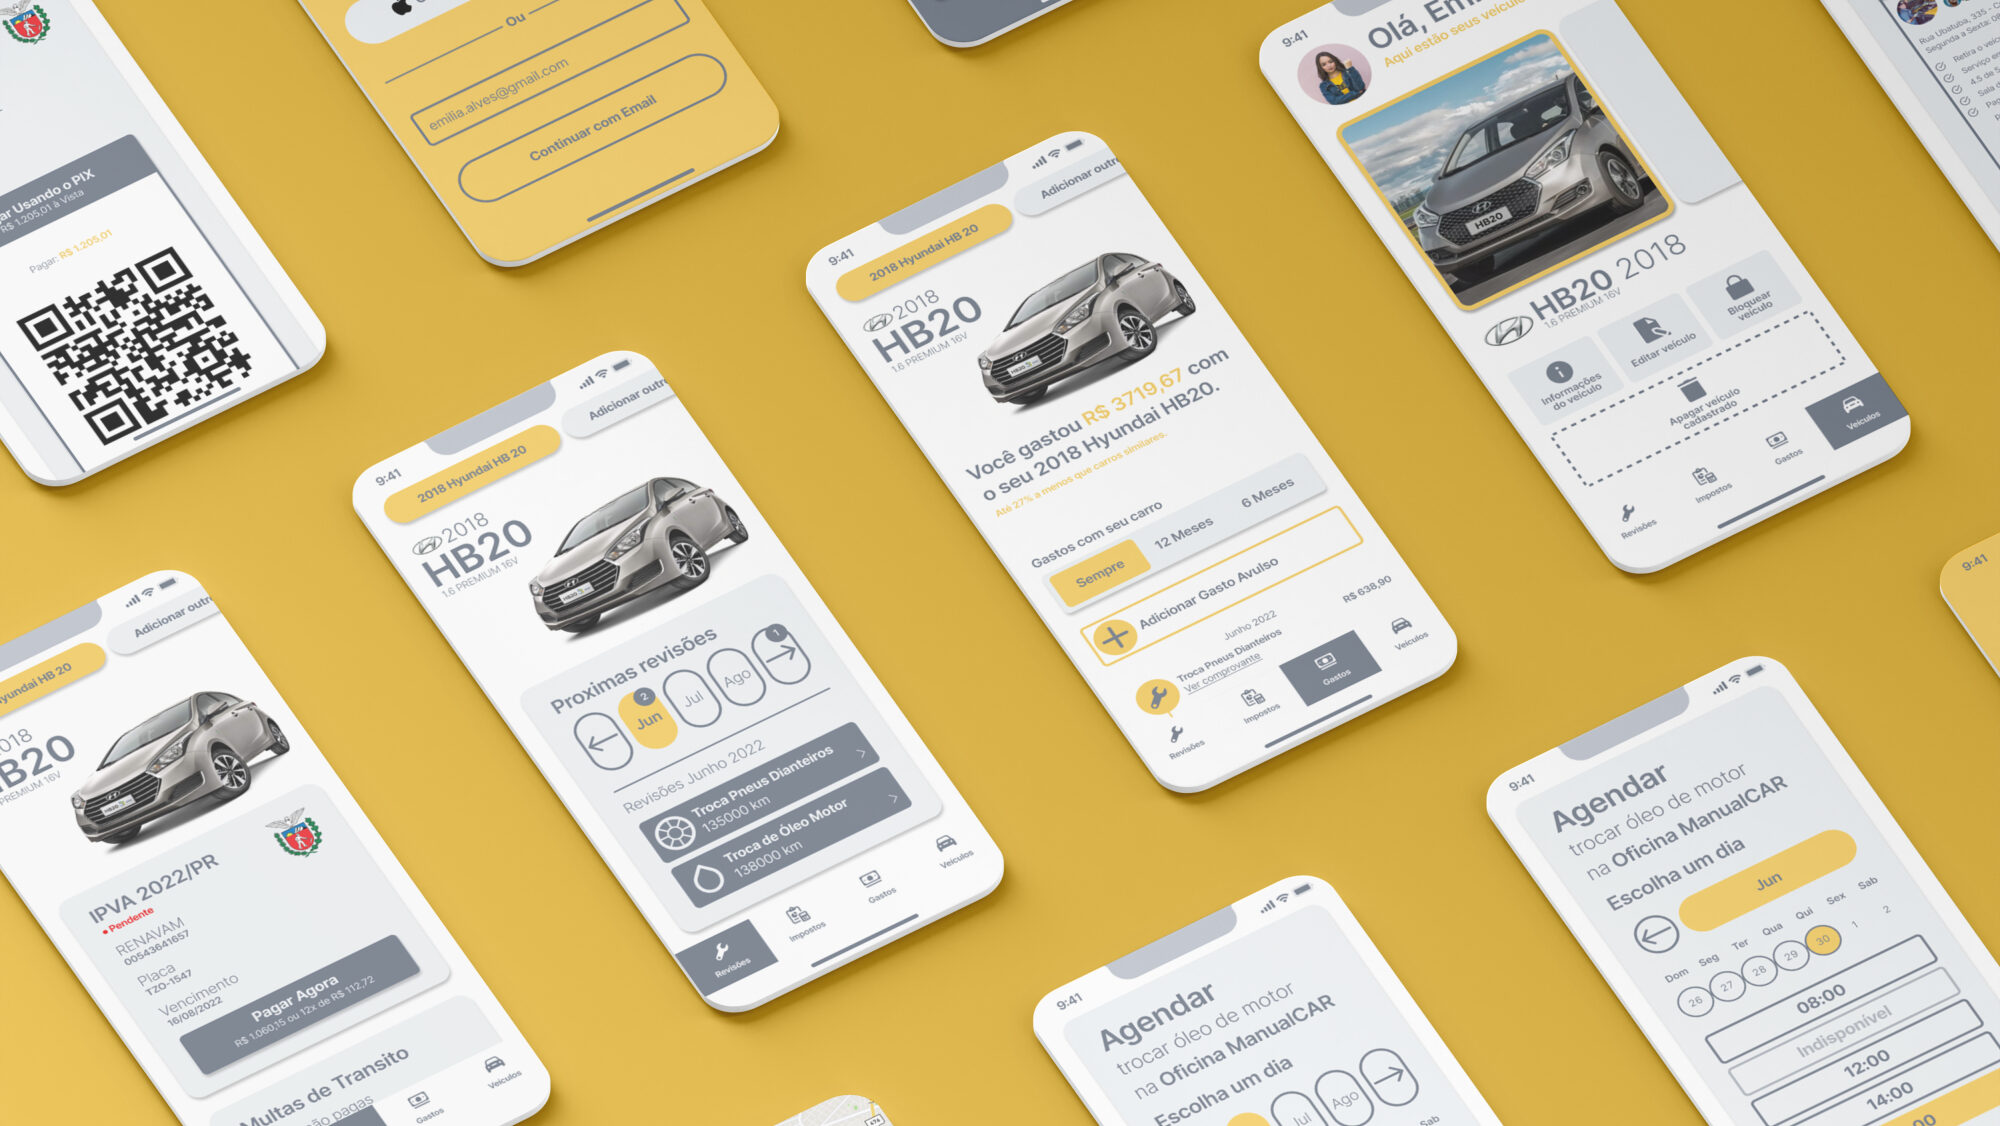
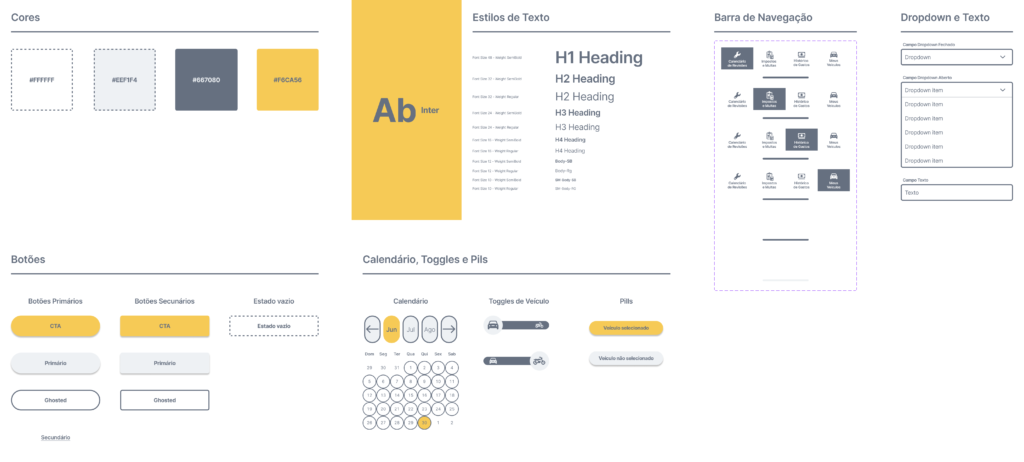
8.3 – First version of the high-fidelity prototype
We decided to create a more elaborate prototype, but with a limited number of screens, to achieve greater accuracy by testing only two features: Paying vehicle taxes and scheduling vehicle maintenance (revisions). In this first version of the high-fidelity prototype, we have already started to define the graphic elements and the visual language of the solution.
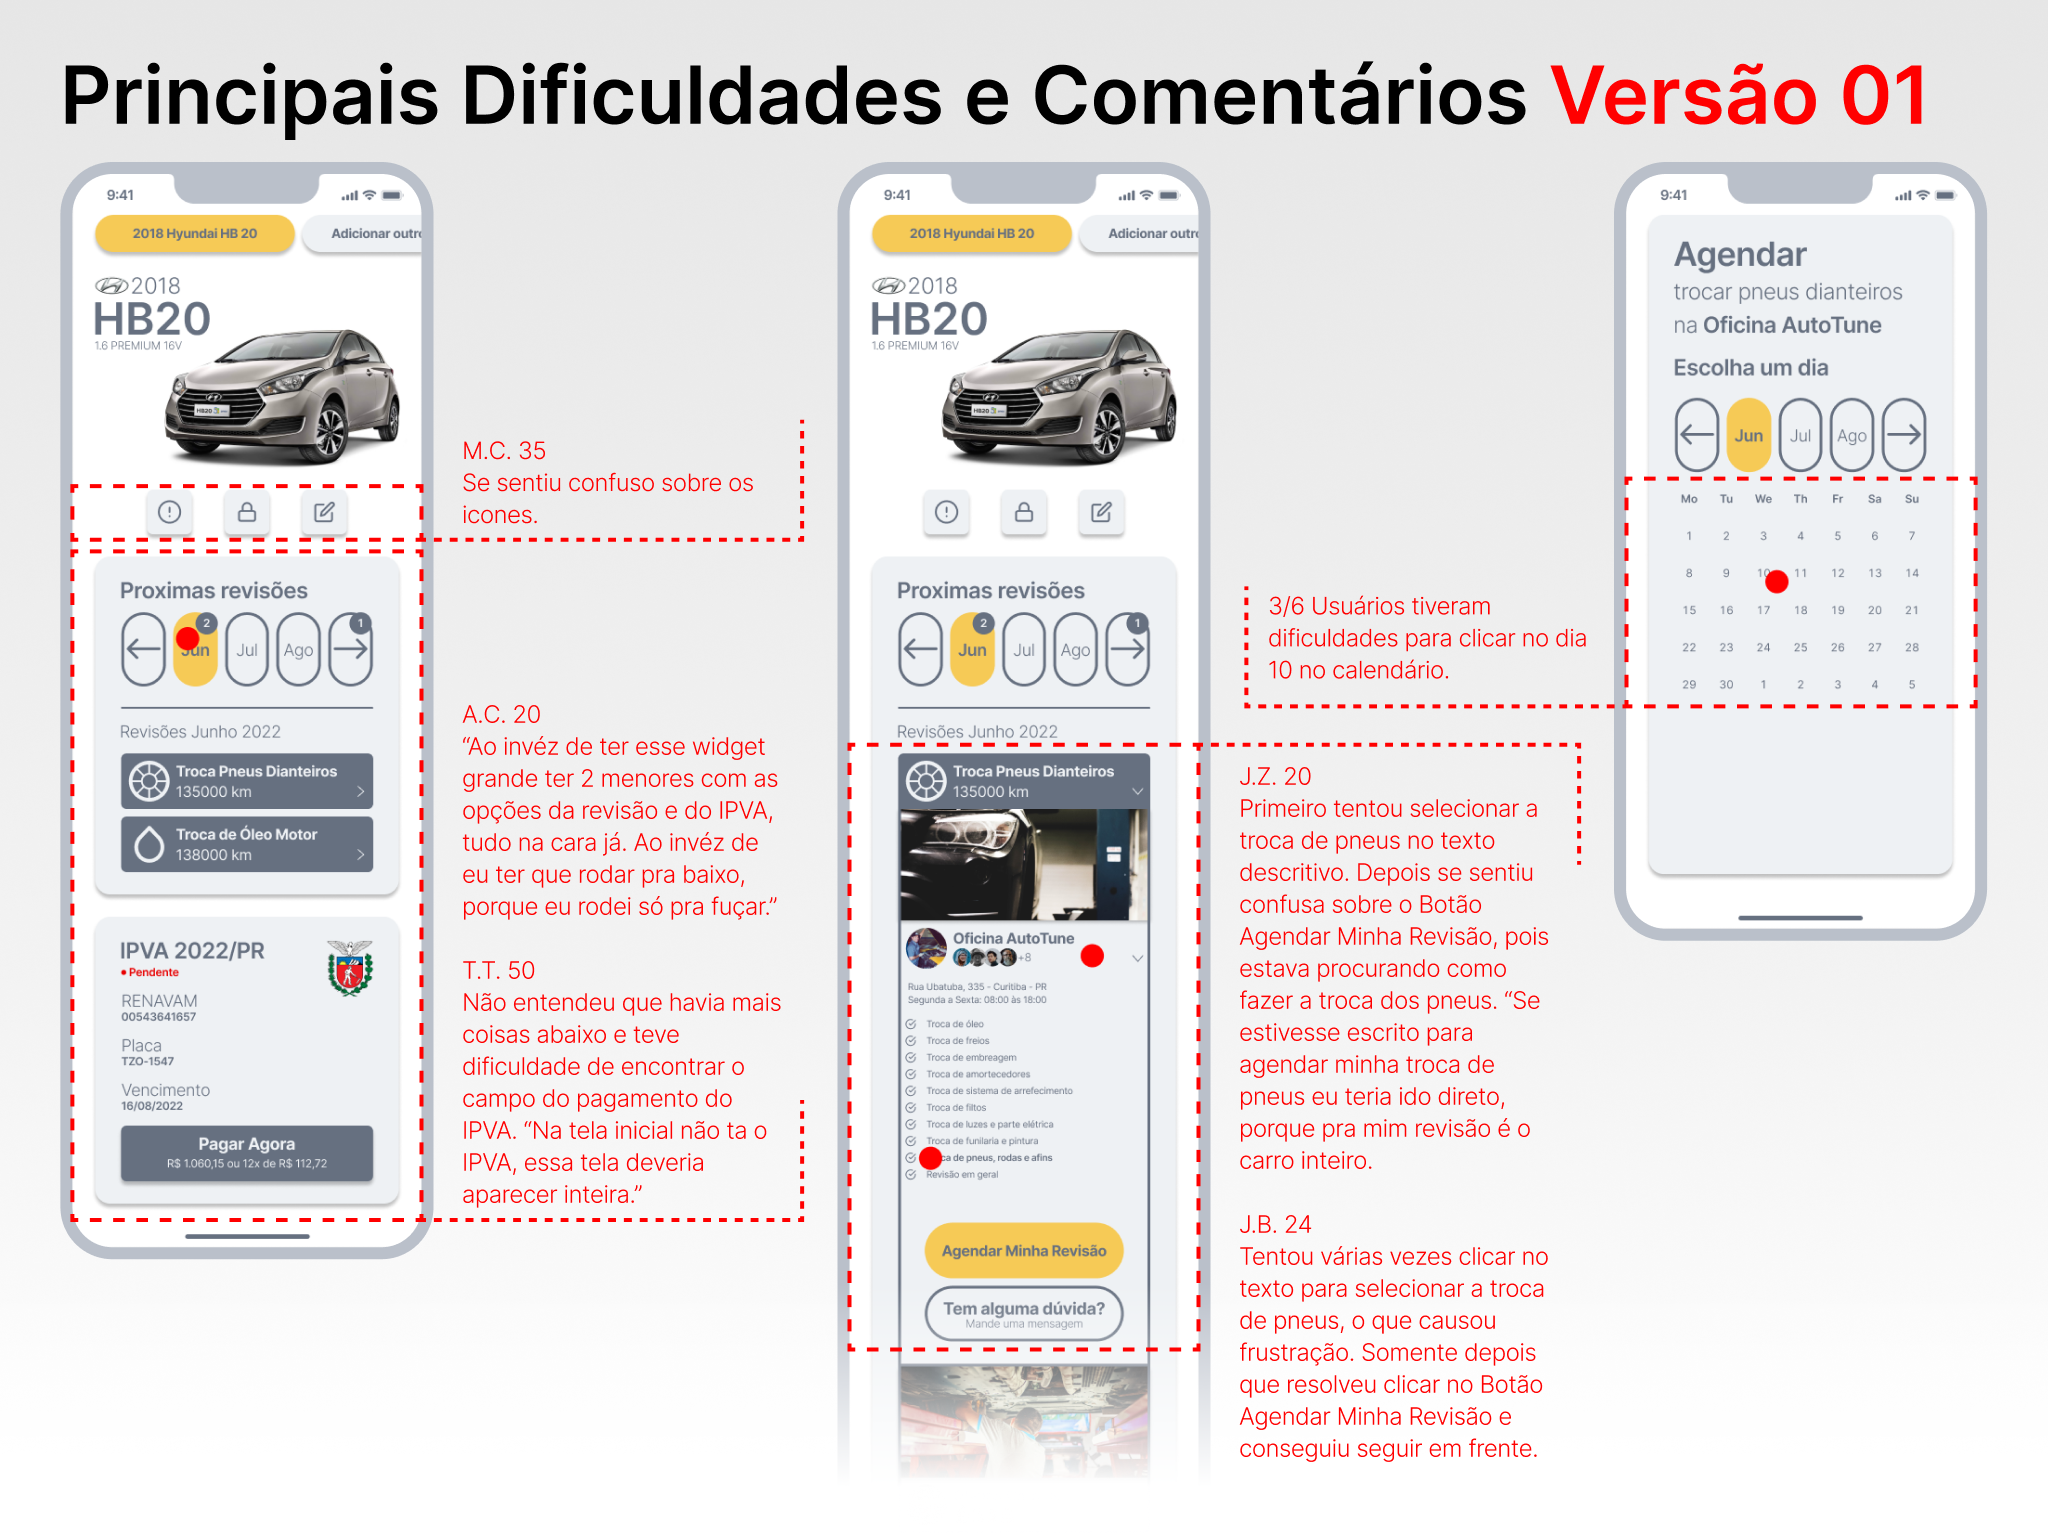
8.4 – Usability testing the first version of the prototype
Six usability tests were carried out where participants were given two missions: First, they would have to schedule a change of the front tires of their vehicle, and then they would have to pay their vehicle tax.
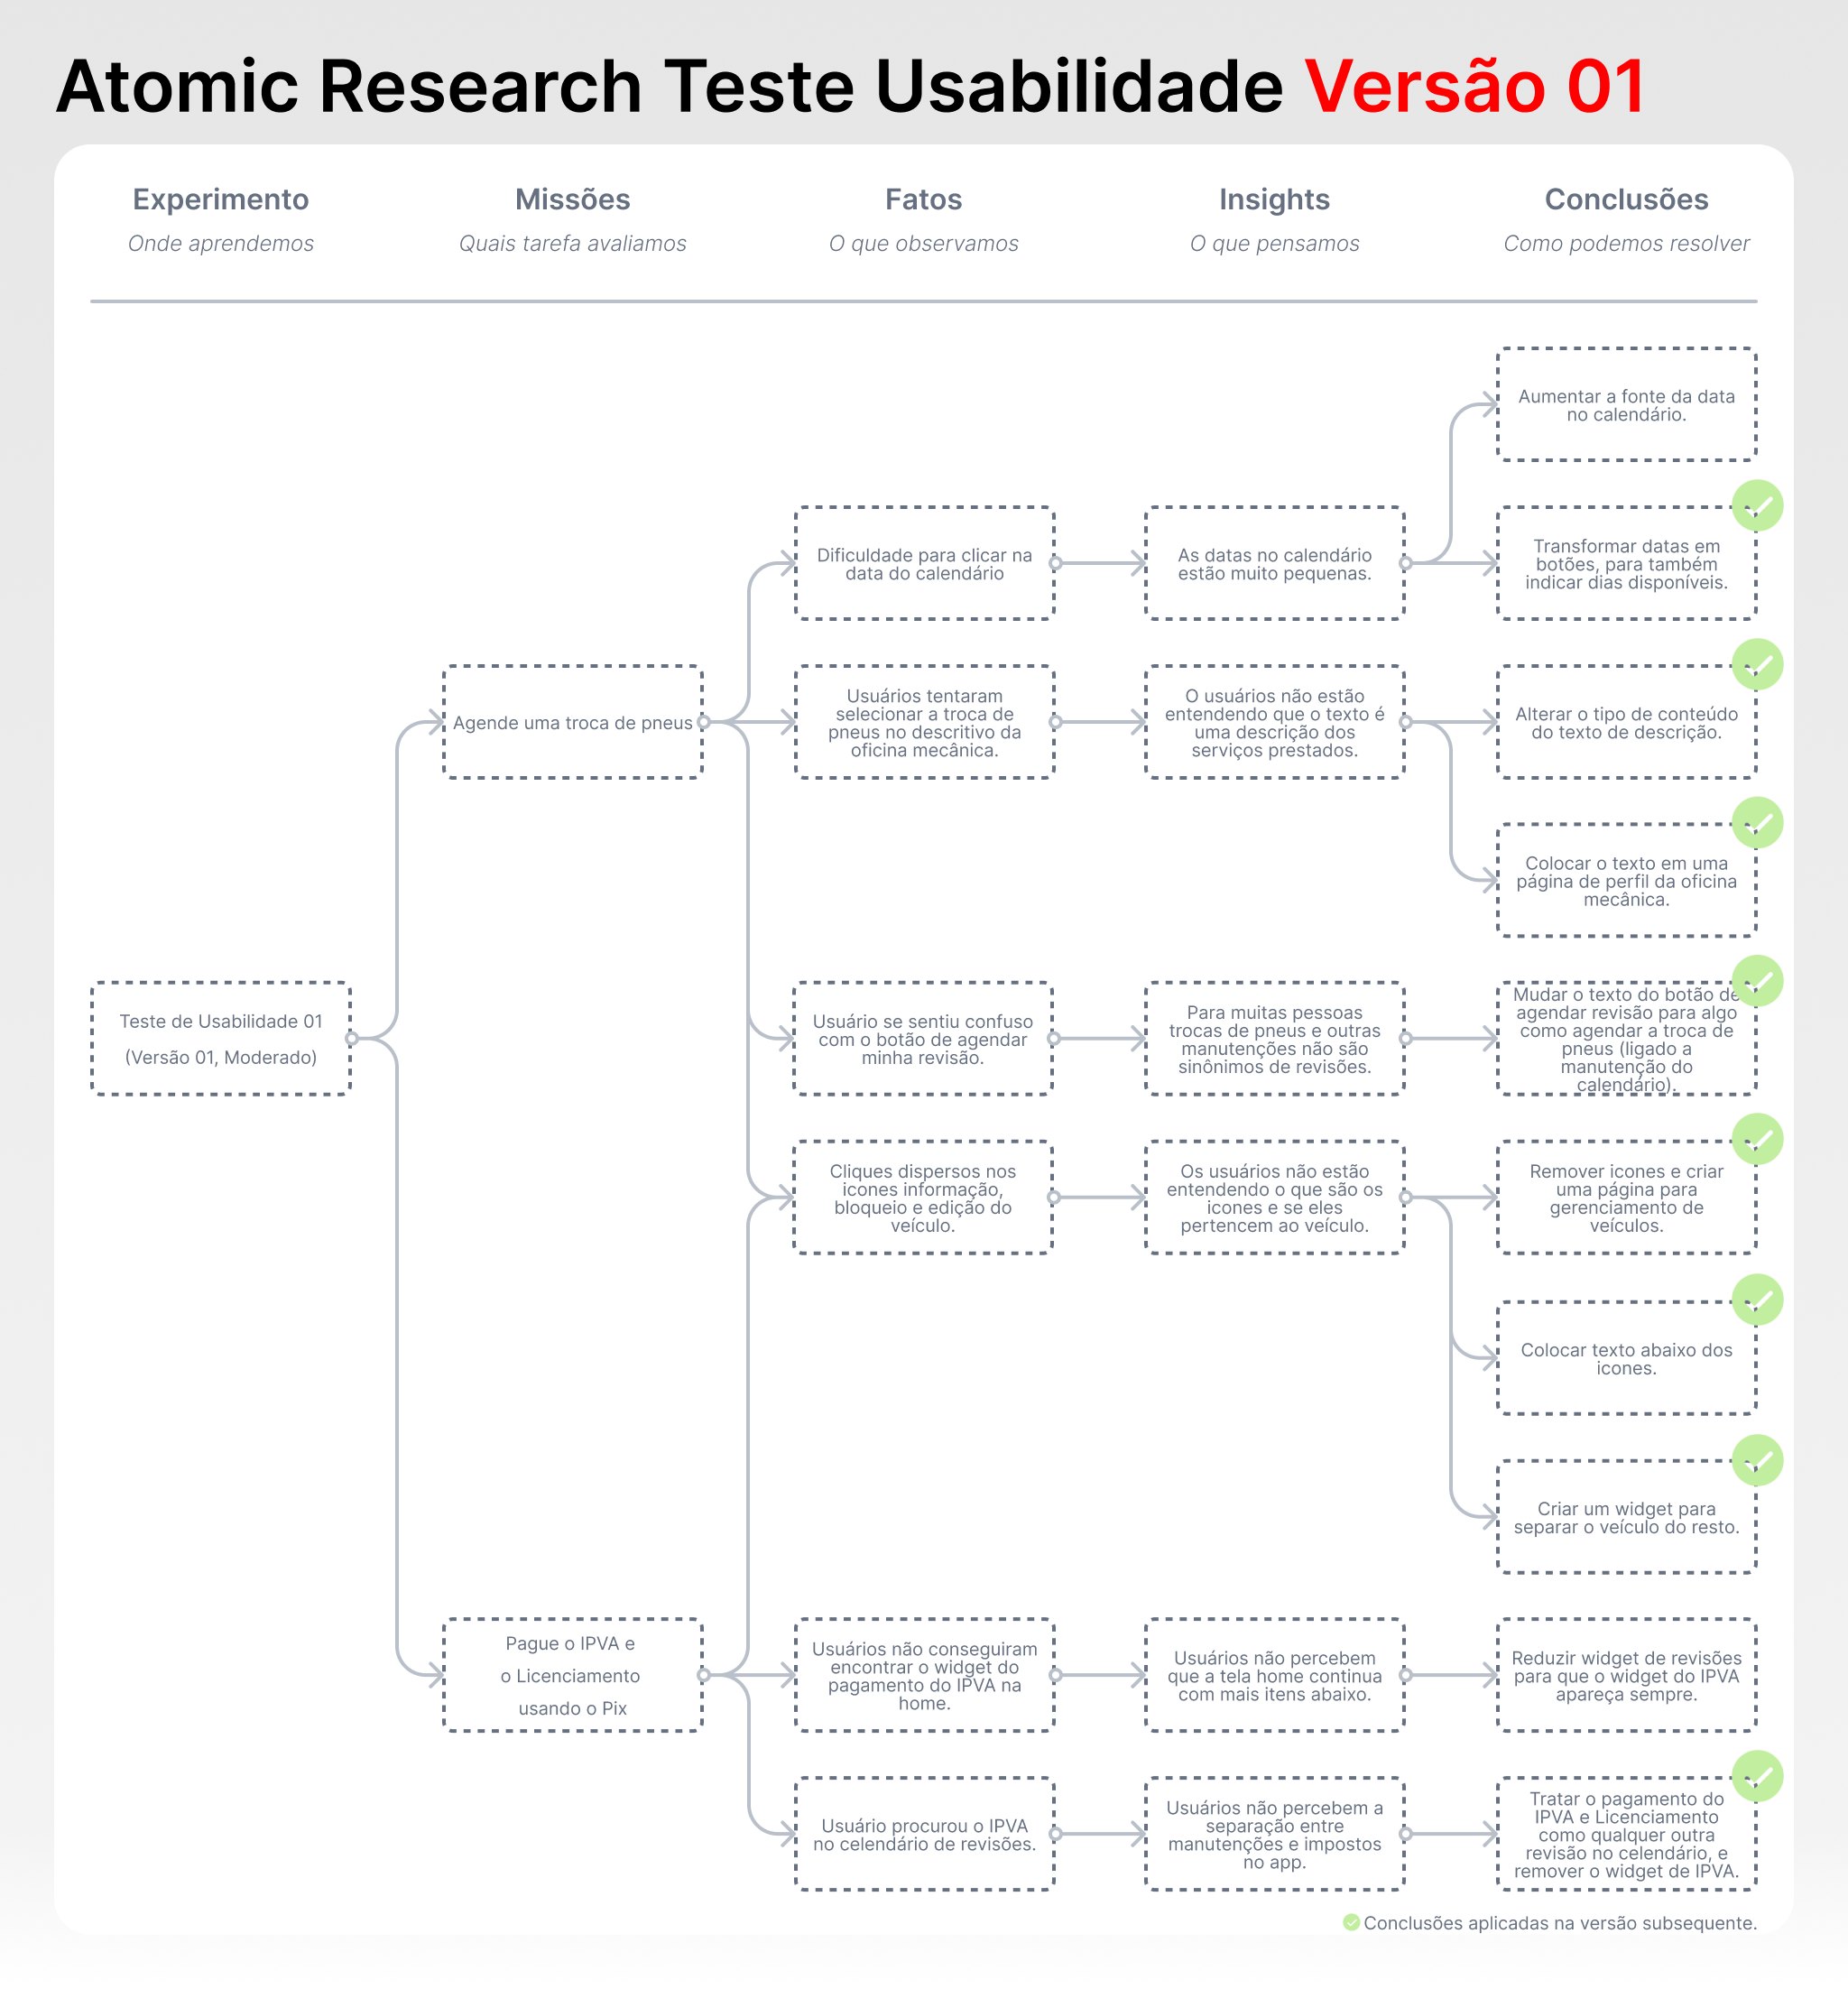
All participants were able to complete both missions, with 5 out of 6 having great ease in the process. Even so, it was possible to identify possible problems. We observed difficulties in understanding icons and buttons on several screens, and also some problems related to the choice of words within the prototype (Ux writing). We plot all the problems we observe using atomic research to generate conclusions and continue the development of the solution.
8.5 – Second version of the high-fidelity prototype
Even though we were able to validate a part of the solution’s UI using the first version of the high-fidelity prototype, it was still very limited to test the different paths (flows) that the user could take to solve a task. In addition, it also did not have everything that was proposed for the MVP, as it was intended to be built quickly to test the two main features.
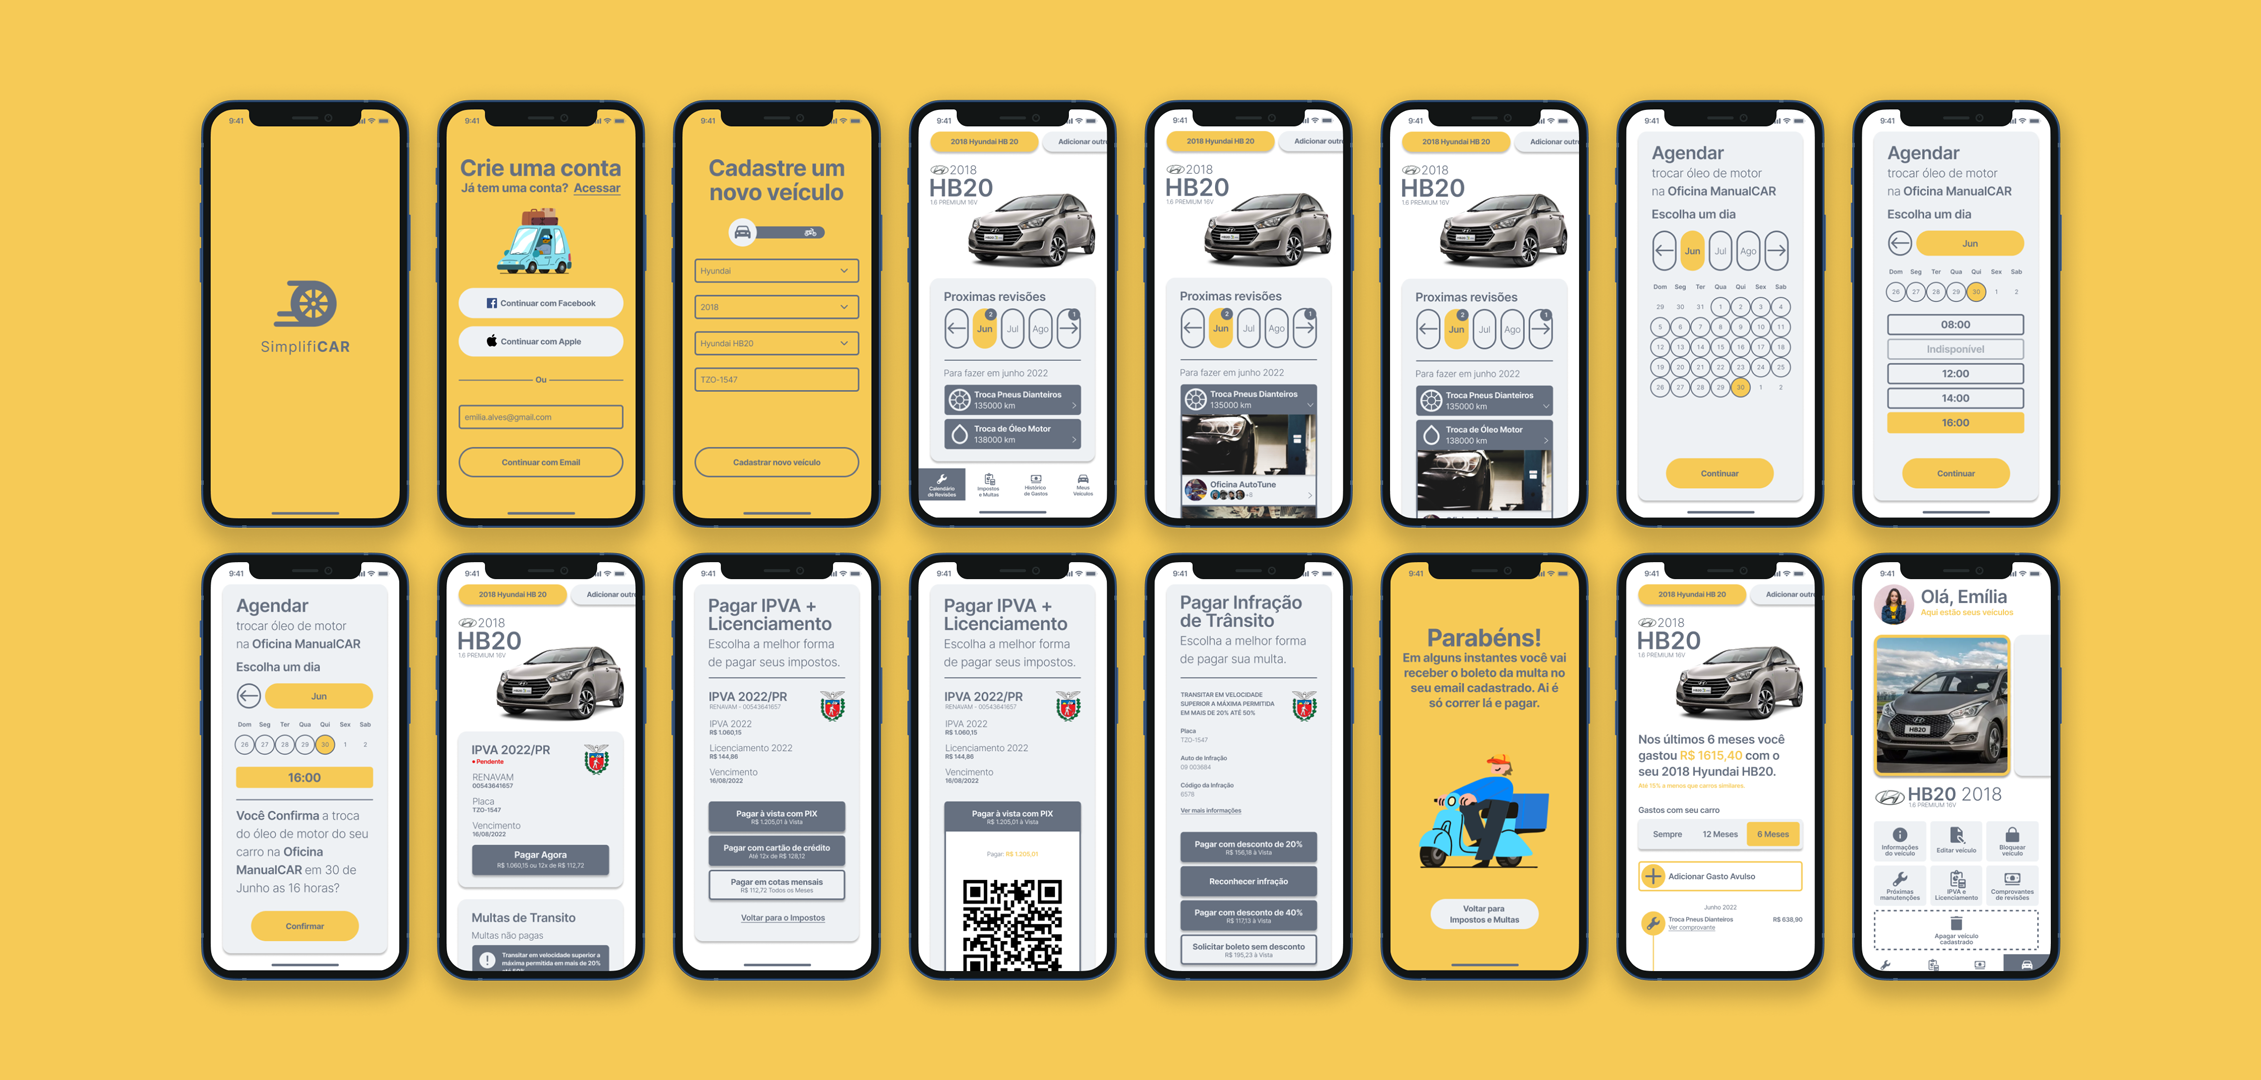
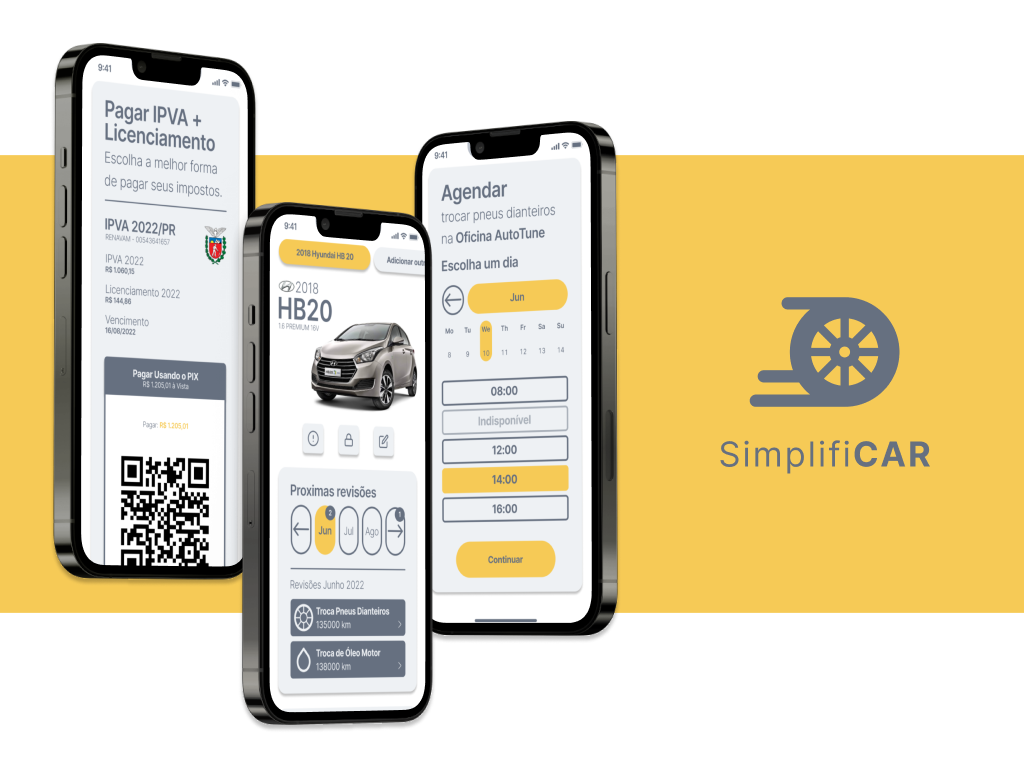
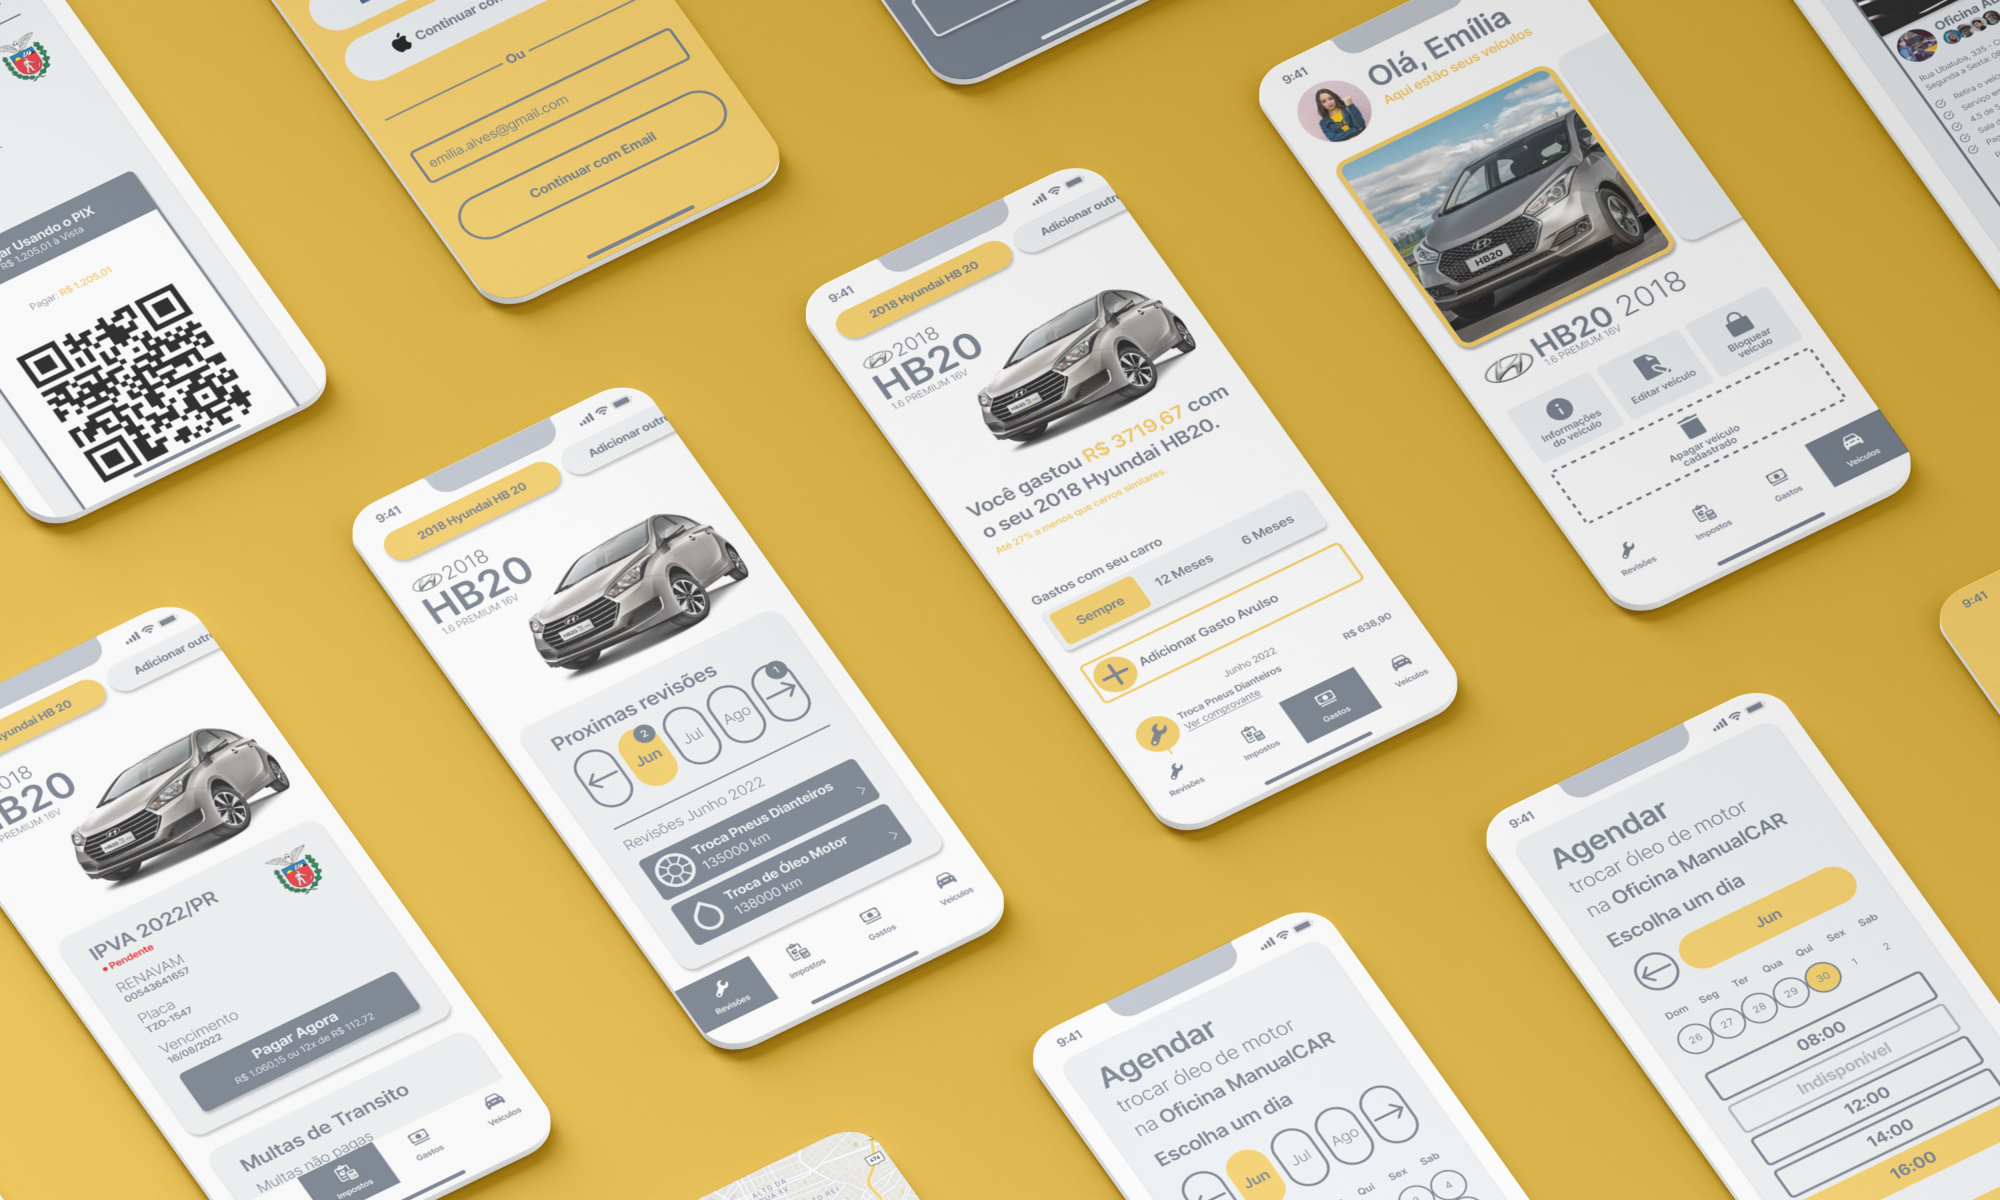
So we went ahead and built a second version of the prototype, this one already applying all the lessons learned from the usability tests made with the previous prototypes and with all the features planned for the MVP, in addition to all the account and vehicle registration screens. The main change in this version was the addition of a Navigation Bar and the separation of the review scheduling part from the tax payment part, and the addition of new features.
8.5 – Usability testing the second version of the prototype
We scheduled usability tests right away to understand how this second version of the prototype was doing. We schedule with the same people who had already tested before and with new participants as well. We planned four missions with the aim of testing the new navigation bar and the new features. In summary, the missions were as follows: 1) Create an account, register a vehicle and pay its taxes using the app. 2) Schedule the replacement of the front tires. 3) Find within the app when was the last time you changed your brake pads. 4) Pay a fine within the app.
These missions are designed to make participants navigate within the solution, and explore almost the entire UI. We were also changing the order of missions for each participant, to reduce the chance of any bias caused by previous missions. If the participant finished quickly, we had an optional fifth mission which was to edit the year of the car already registered.
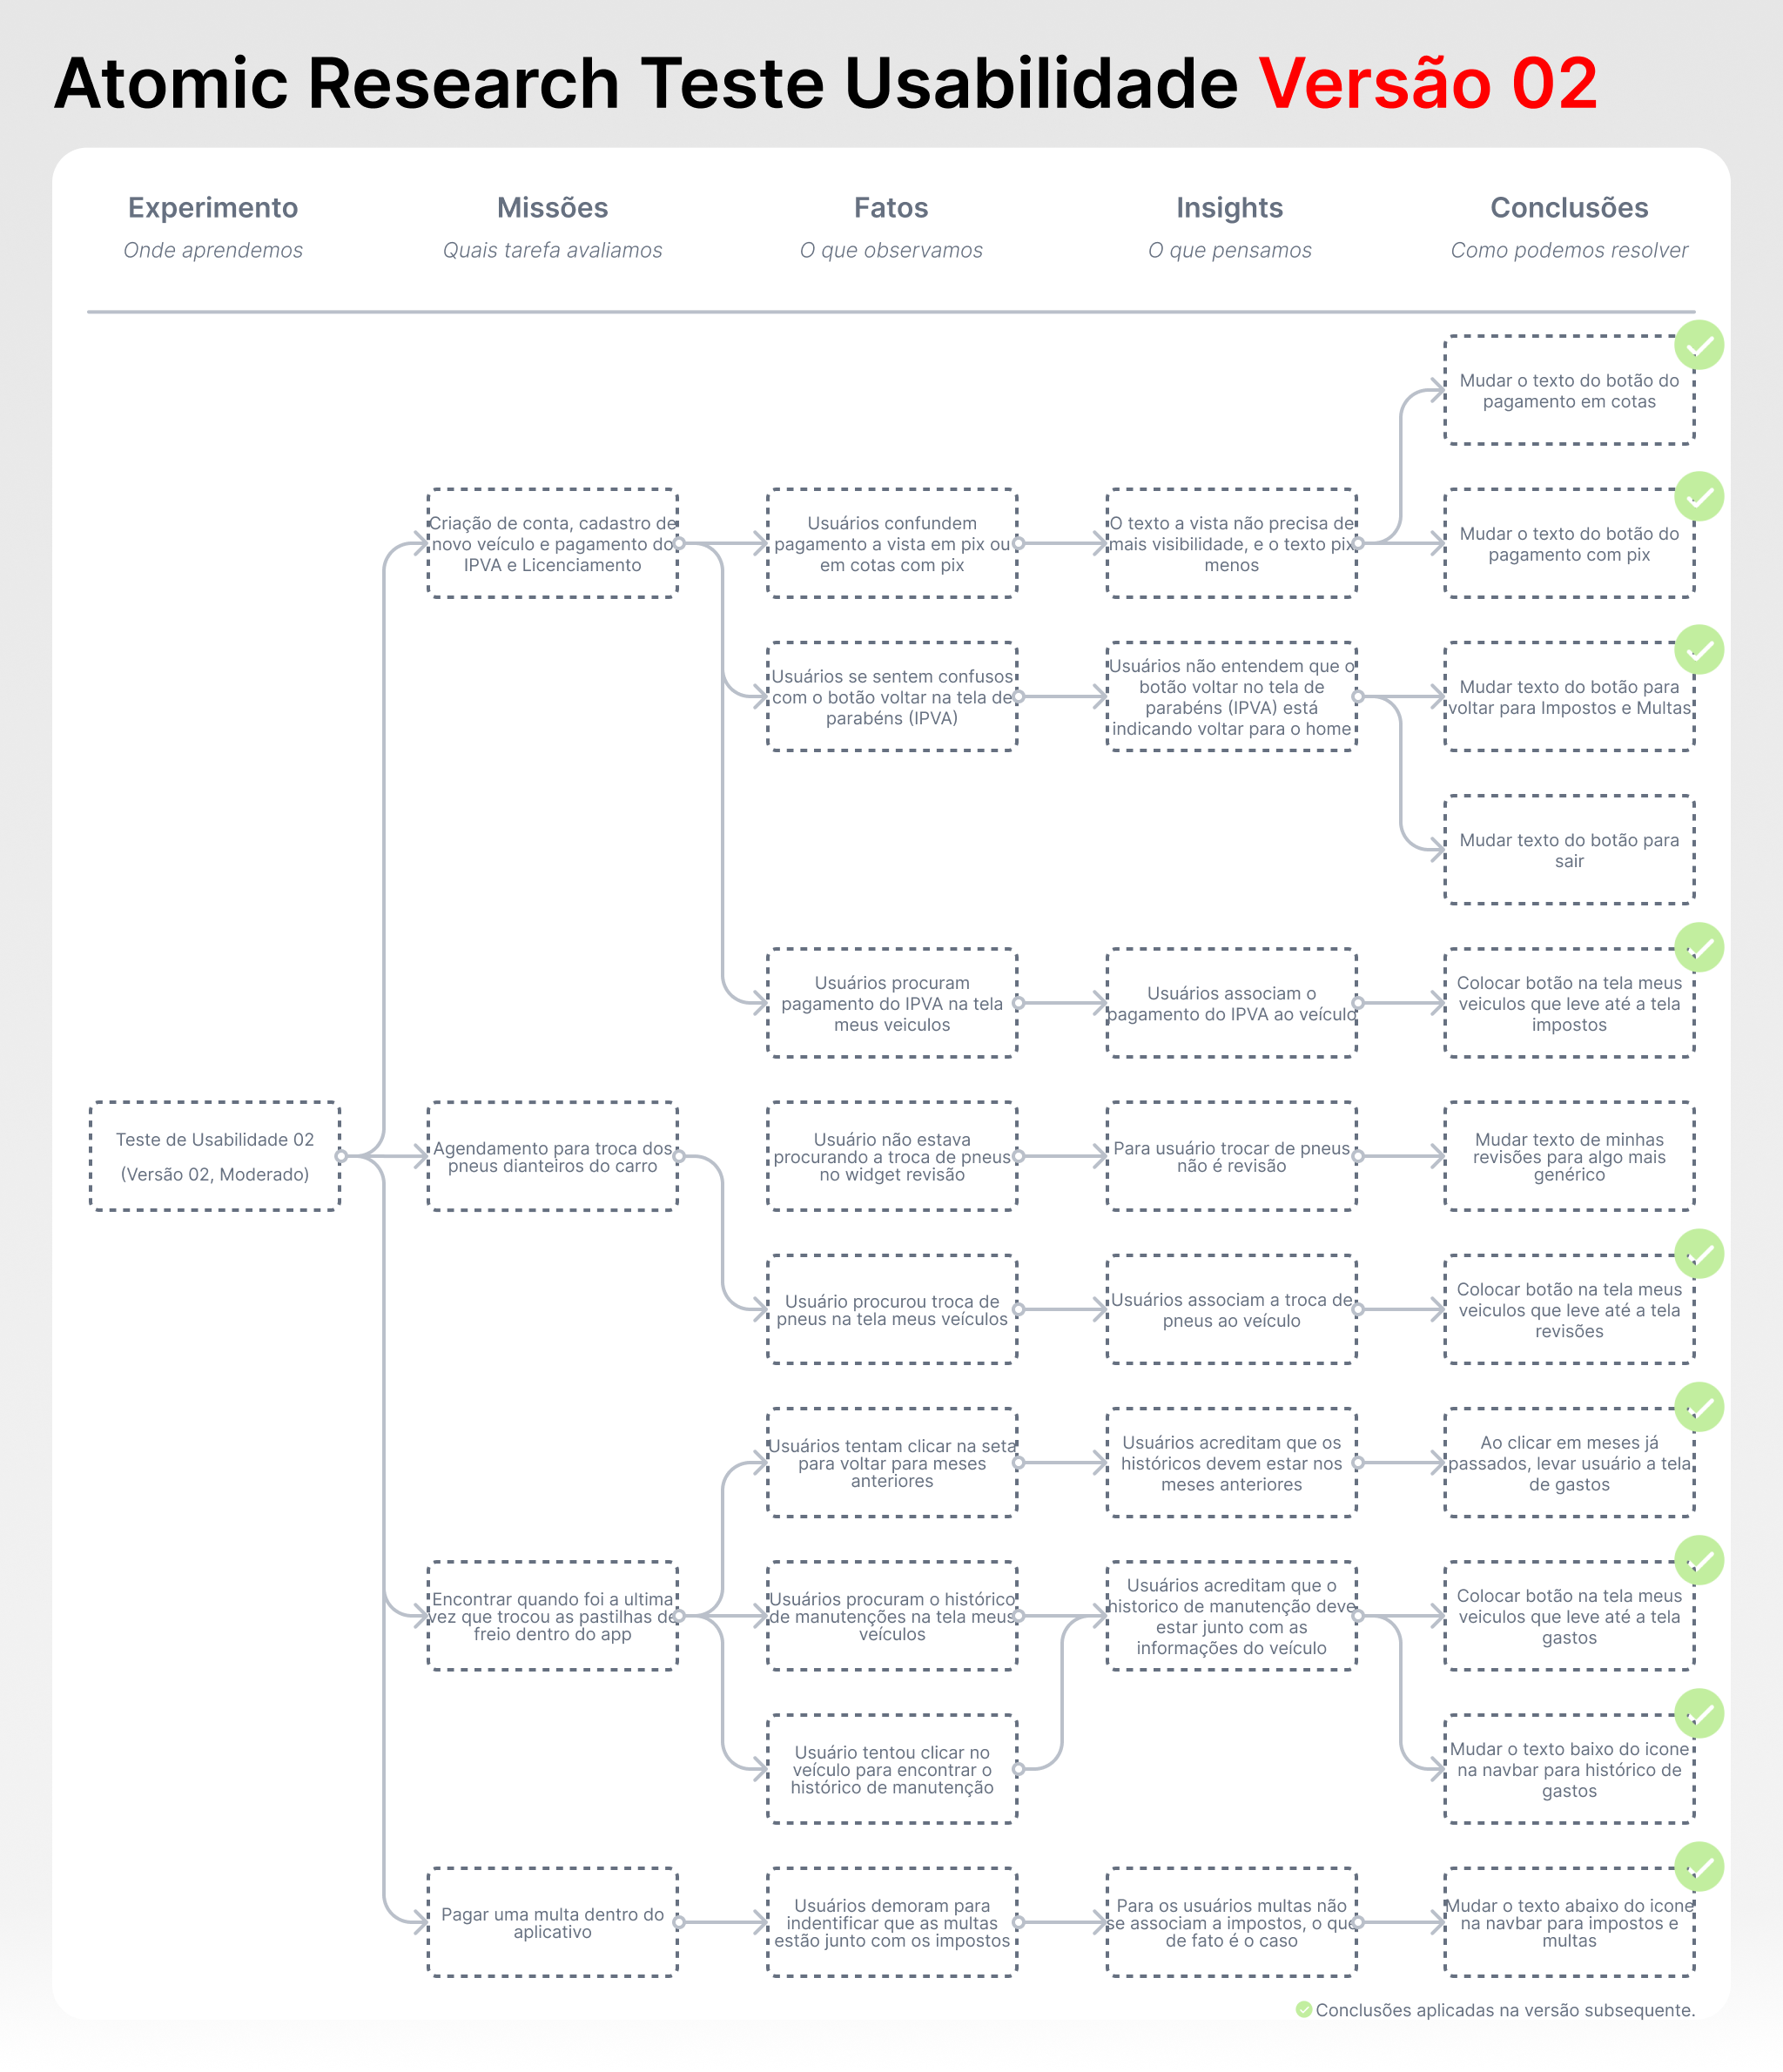
We did 10 usability tests with this version, 5 of them with people who had already tested previous versions and 5 with new users. 9 out of 10 people managed to complete all the tasks, only one showed a lot of difficulty finding their recent vehicle expenses.
The vast majority of the problems we observed were linked to the vocabulary used throughout the prototype, which demonstrates that some keywords throughout the application do not conform to the users’ mental model. We also noticed a problem related to the new My Vehicles screen, which for some reason ends up attracting users straight to it in the mission to find the value of a past purchase. Again, we plotted all the problems observed in an Atomic Research.
9 – The final version of the app
From the problems identified in the usability tests of the second version, and using the ideas thought in atomic research, we developed our third version of the high-fidelity prototype. The changes from previous versions were few and almost exclusive to the words used throughout the prototype. However, we also added new buttons to the My Vehicles screen creating a new flow through the app based on what we saw during the usability tests. Now users can find almost all the app’s functionality on that screen, which creates a secondary path. Thus, the third version gained more interaction and more ways to satisfactorily support a greater number of mental models. We realized how this was a clear evolution directly linked to the usability tests carried out throughout the process.
📲 Click here to interact with the prototype! (Prototype in Brazilian Portuguese)
9 – Next steps
The next steps are to continue refining the prototype through usability tests and to develop a research focused on the words used by users, areas that felt more difficult when interacting with the application. We also understand that the prototype still needs to have its interface refined and receive animations. But we believe that we have developed a solution that responds to the problems encountered by many vehicle owners in their daily lives, creating ways to simplify time-consuming and bureaucratic processes. All this from a viable business plan that can be built.